.
Today, Premier Kathleen Wynne finally announced changes to real estate in Ontario in an attempt to increase supply and address affordability.
No doubt, there's going to be some confusion about the effects of the changes. Keep in mind though, the fundamentals of a healthy market have not changed.
Take a look at the plan below, point-by-point. If you've got any questions just give me a shout.
There are 16 proposed measures:
- A 15-per-cent non-resident speculation tax to be imposed on buyers in the Greater Golden Horseshoe area who are not citizens, permanent residents or Canadian corporations.
- Expanded rent control that will apply to all private rental units in Ontario, including those built after 1991, which are currently excluded.
- Updates to the Residential Tenancies Act to include a standard lease agreement, tighter provisions for “landlord’s own use” evictions, and technical changes to the Landlord-Tenant Board meant to make the process fairer, as well as other changes.
- A program to leverage the value of surplus provincial land assets across the province to develop a mix of market-price housing and affordable housing.
- Legislation that would allow Toronto and possibly other municipalities to introduce a vacant homes property tax in an effort to encourage property owners to sell unoccupied units or rent them out.
- A plan to ensure property tax for new apartment buildings is charged at a similar rate as other residential properties.
- A five-year, $125-million program aimed at encouraging the construction of new rental apartment buildings by rebating a portion of development charges.
- More flexibility for municipalities when it comes to using property tax tools to encourage development.
- The creation of a new Housing Supply Team with dedicated provincial employees to identify barriers to specific housing development projects and work with developers and municipalities to find solutions.
- An effort to understand and tackle practices that may be contributing to tax avoidance and excessive speculation in the housing market.
- A review of the rules real estate agents are required to follow to ensure that consumers are fairly represented in real estate transactions.
- The launch of a housing advisory group which will meet quarterly to provide the government with ongoing advice about the state of the housing market and discuss the impact of the measures and any additional steps that are needed.
- Education for consumers on their rights, particularly on the issue of one real estate professional representing more than one party in a real estate transaction.
- A partnership with the Canada Revenue Agency to explore more comprehensive reporting requirements so that correct federal and provincial taxes, including income and sales taxes, are paid on purchases and sales of real estate in Ontario.
- Set timelines for elevator repairs to be established in consultation with the sector and the Technical Standards & Safety Authority.
- Provisions that would require municipalities to consider the appropriate range of unit sizes in higher density residential buildings to accommodate a diverse range of household sizes and incomes, among other things.
If you’re thinking of making a move and would like to know how I can help, feel free to contact me for more info.
 Following is TREB’s market report for March 2017:
 Following is TREB’s market report for February 2017:
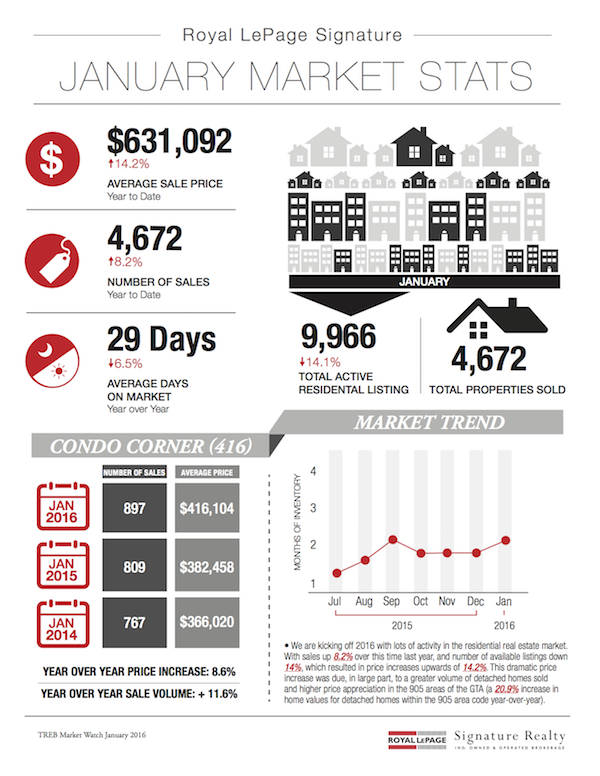
 Following is TREB’s market report for January 2017:
 Following is TREB’s market report for the year 2016:
 Following is TREB’s market report for October 2016:
 Following is TREB’s market report for August 2016:
 Following is TREB’s market report for June 2016:
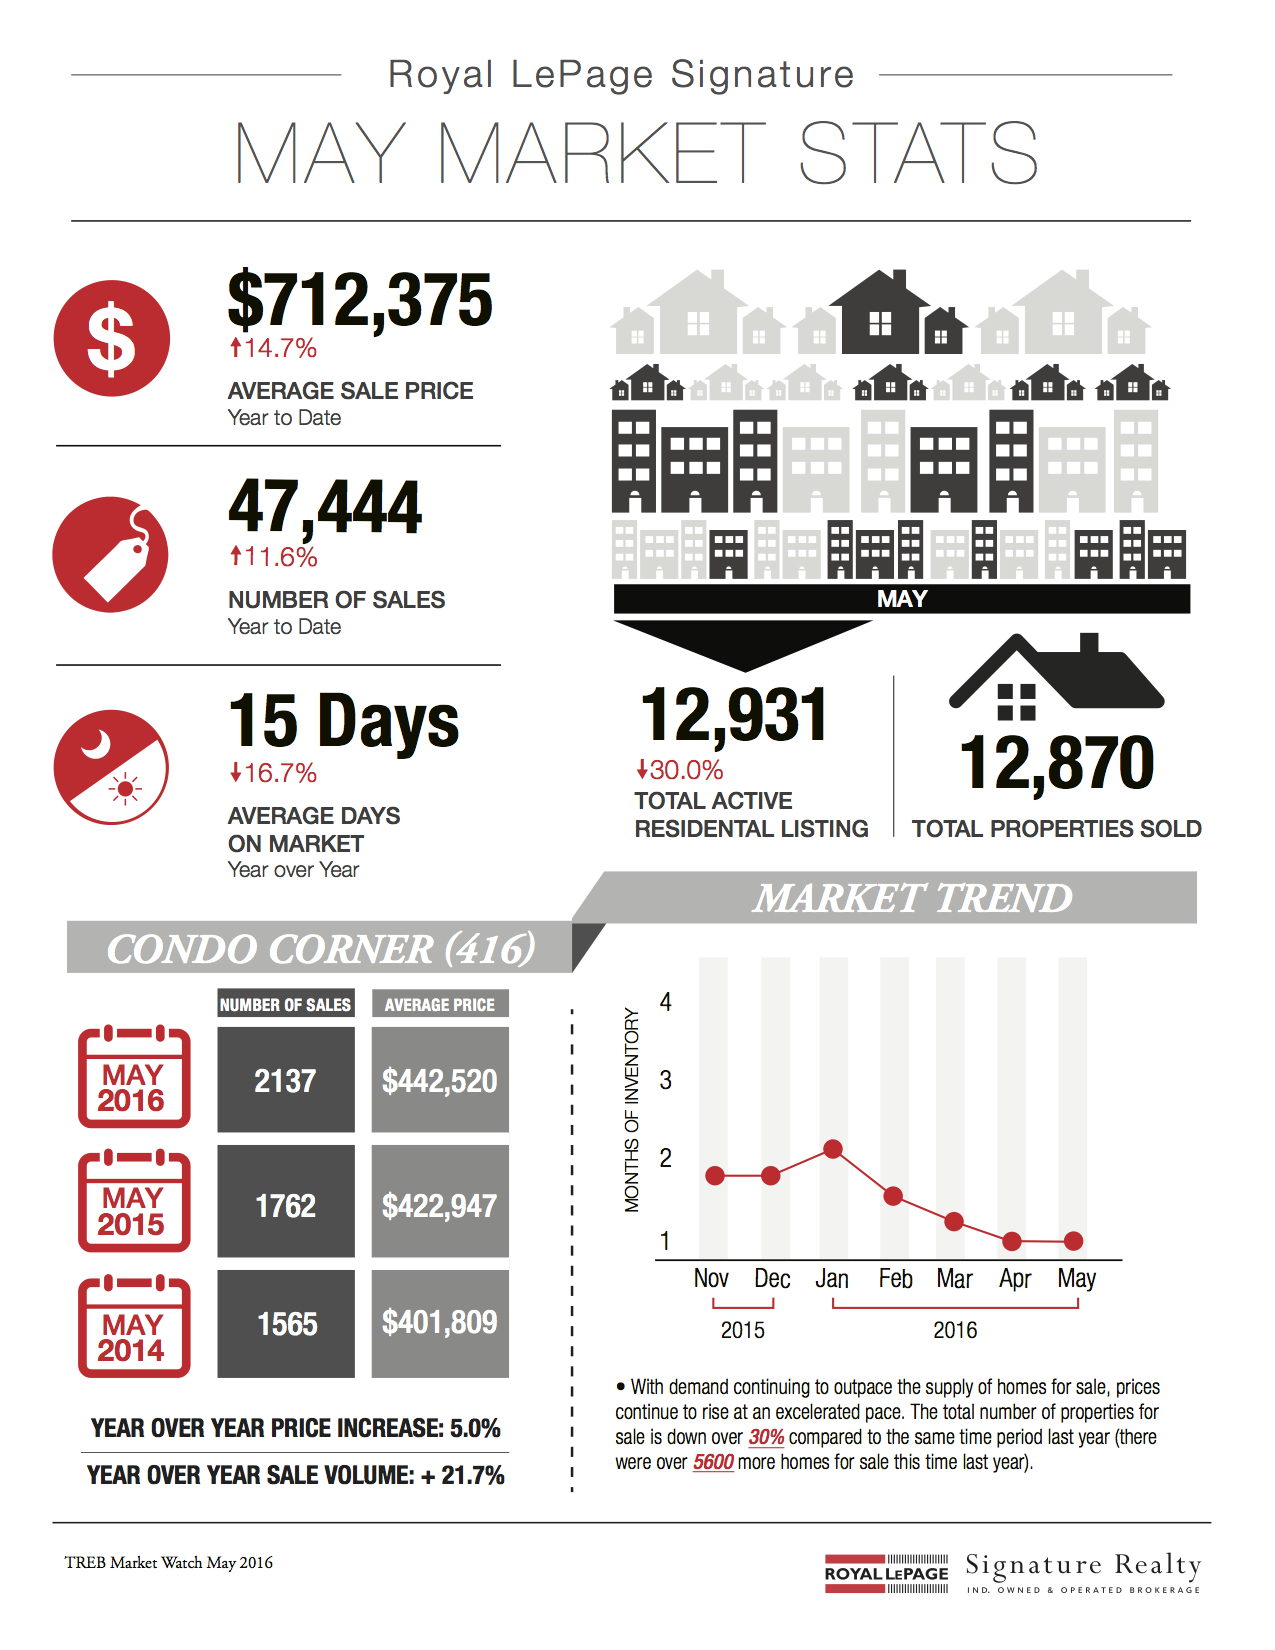 Following is TREB’s market report for May 2016:
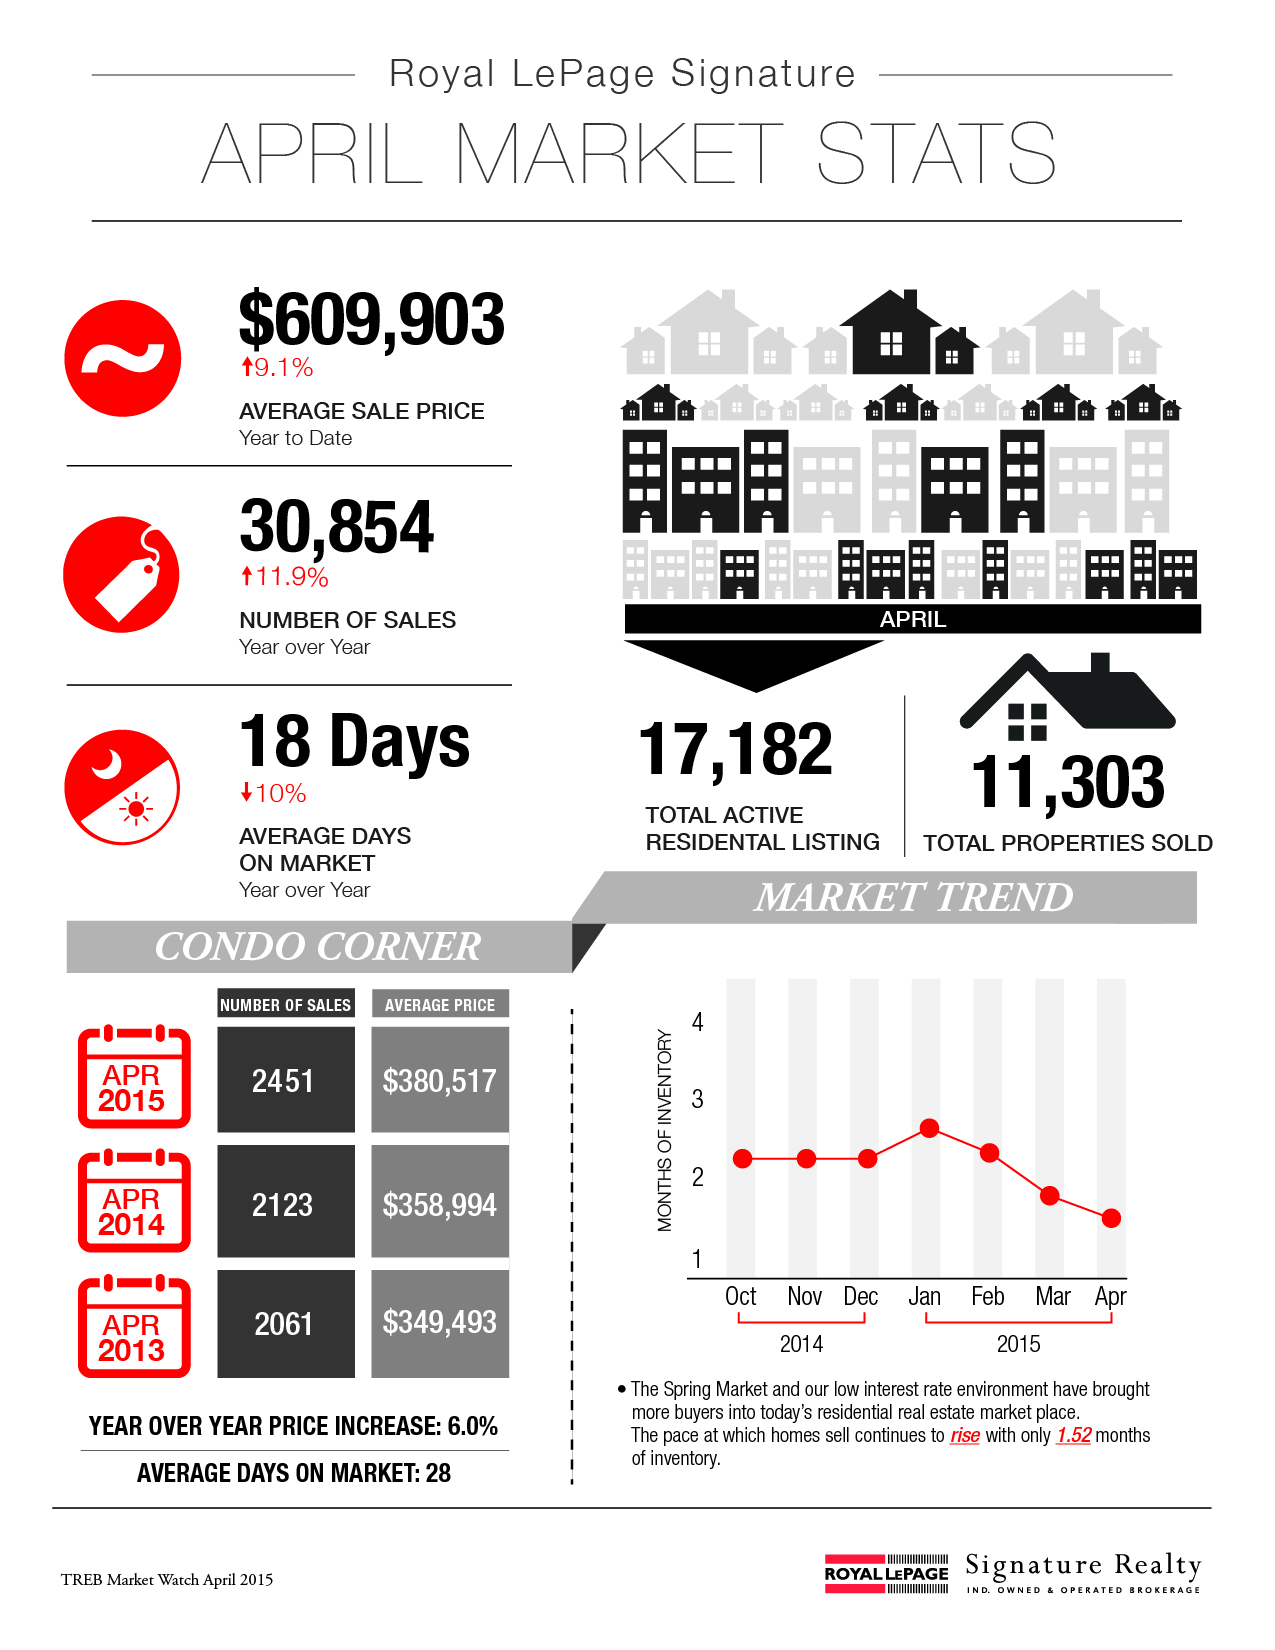
 Following is TREB’s market report for April 2016:
 Following is TREB's market report for November 2015:
 Following is TREB's market report for September 2015:
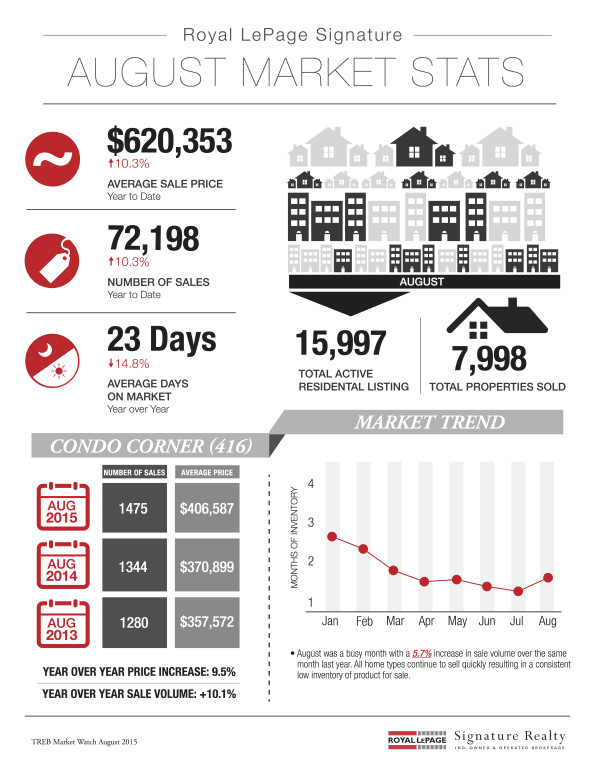

 Following is TREB's market report for July 2015: