How would you feel if you purchased a home in a particular neighbourhood specifically because of the school catchment, only to find later that your child would actually be going to a different (arguably less desirable) school?
That's basically what's happened to a bunch of young families who live in Liberty Village.
Up until April of this year it was understood that Liberty Village was part of the Givins/Shaw catchment.
About halfway through the month though, a letter went out informing everyone of a proposed redistricting. My family got the notice because we live in the catchment (my oldest daughter is starting kindergarten at Givins/Shaw in September, and her younger sister will be following suit in another couple of years).
The letter contained a poorly detailed map showing where the new boundaries would be; the map was vague and had a lot of people unsure of whether or not they’d be affected.
None of us got any real answers until the public meeting that was held a couple of weeks later in early May.
I was at that meeting, and what it all boils down to is this:
Givins/Shaw school is over capacity now and will certainly be unable to accommodate all of the students that are entering the system over the next bunch of years. The school board took a look at the neighbouring schools, and saw that the Queen Victoria school in Parkdale was well under capacity. So, it made sense for them to propose a rejigging of the catchment boundaries and send a chunk of the population over to Queen Victoria. Liberty Village will make up the bulk of that chunk.
Are parents in Liberty Village upset with this news? Without a doubt.
A bunch of Liberty Village parents were there at the meeting in May to voice their opinions about the proposed redistricting and about how all of this has been handled.
We heard from one father who's now going to have two sons in different schools at the same time. The logistics of dropping off and picking up his boys is going to be a daily hassle, and it’s going to significantly alter their after-school routine (which currently consists of quality-time spent in the Givins/Shaw area).
We heard from another parent who said their home search was based primarily around buying into the Givins/Shaw catchment. If they had known that the catchment was going to change, they never would've bought in Liberty Village.
From my perspective as a realtor, it's this last point that interests me most.
School catchment is usually at the top of the list of must-haves & deal-breakers when a young family shops for a new home. It’s certainly a big part of my focus when I’m working with buyers who fit into this category.
And while I’ve seen catchments get tweaked in the past (some clients of mine got a helluva deal in Roncesvalles last year, partially because of this catchment change), it’s rare to see an entire neighbourhood get redistricted the way that Liberty Village is going to be.
“Shouldn’t residents in Liberty Village have seen this coming?” I’ve heard some people say. “How can you realistically think that there wouldn’t eventually be some sort of change in such a quickly-developing area?”
Fair enough. But I think the fact that the parents weren’t notified of anything beforehand is one of the hardest things to swallow here.
And I think a number of parents assumed that other measures would’ve been taken.
A few alternative solutions were brought up by parents at the meeting: Why not build a new school in (or near) Liberty Village? What not rent space from the Artscape building on Shaw St? Why not take over the Señor Santos Catholic School at Ossington and Osler? Why not build an additional storey onto the current Givins/Shaw building? Why not consider adding portables at Givins/Shaw?
Many parents wondered why the TDSB didn’t start planning for all of this sooner; didn’t they see that the demographics in Liberty Village showed an increasing number of families?
The TDSB’s answer to this last question was simple: “We didn’t anticipate that families would be living in condos.”
Honestly, I think a lot of people didn’t anticipate it either. With the prices of freehold homes at such a high though, condo-living has become a much more viable option for many.
And the numbers are there to prove it.
While Liberty Village is home to plenty of young professionals (singles and couples), there’s no denying that families also make up a significant part of the population. Just take a look a this Toronto Star article from January 2016.
As it stands now, the board is reviewing the proposed redistricting and taking into account the feedback that was provided by parents at the meeting in May. We should have an update in the next couple of weeks about how the changes will be implemented.
It's important to note that not all children in Liberty Village will be going to Queen Victoria; the proposal outlines a set of criteria where certain children will be attending Givins/Shaw. You can read the latest news about the proposal/review on the TDSB website here.
Regardless of the specifics, the catchment boundaries are changing in September 2017 and Liberty Village is going to be affected by the change more than anyone.
Going forward, this will hopefully serve as an example (to school boards, housing developers, and parents alike) that rapidly growing neighbourhoods/areas are subject to change, and plans need to be set in place for how to handle a growing school population. Other areas in the city have already done this, so there is certainly a precedent.
If you’re thinking of making a move and would like to know how I can help, feel free to contact me for more info.
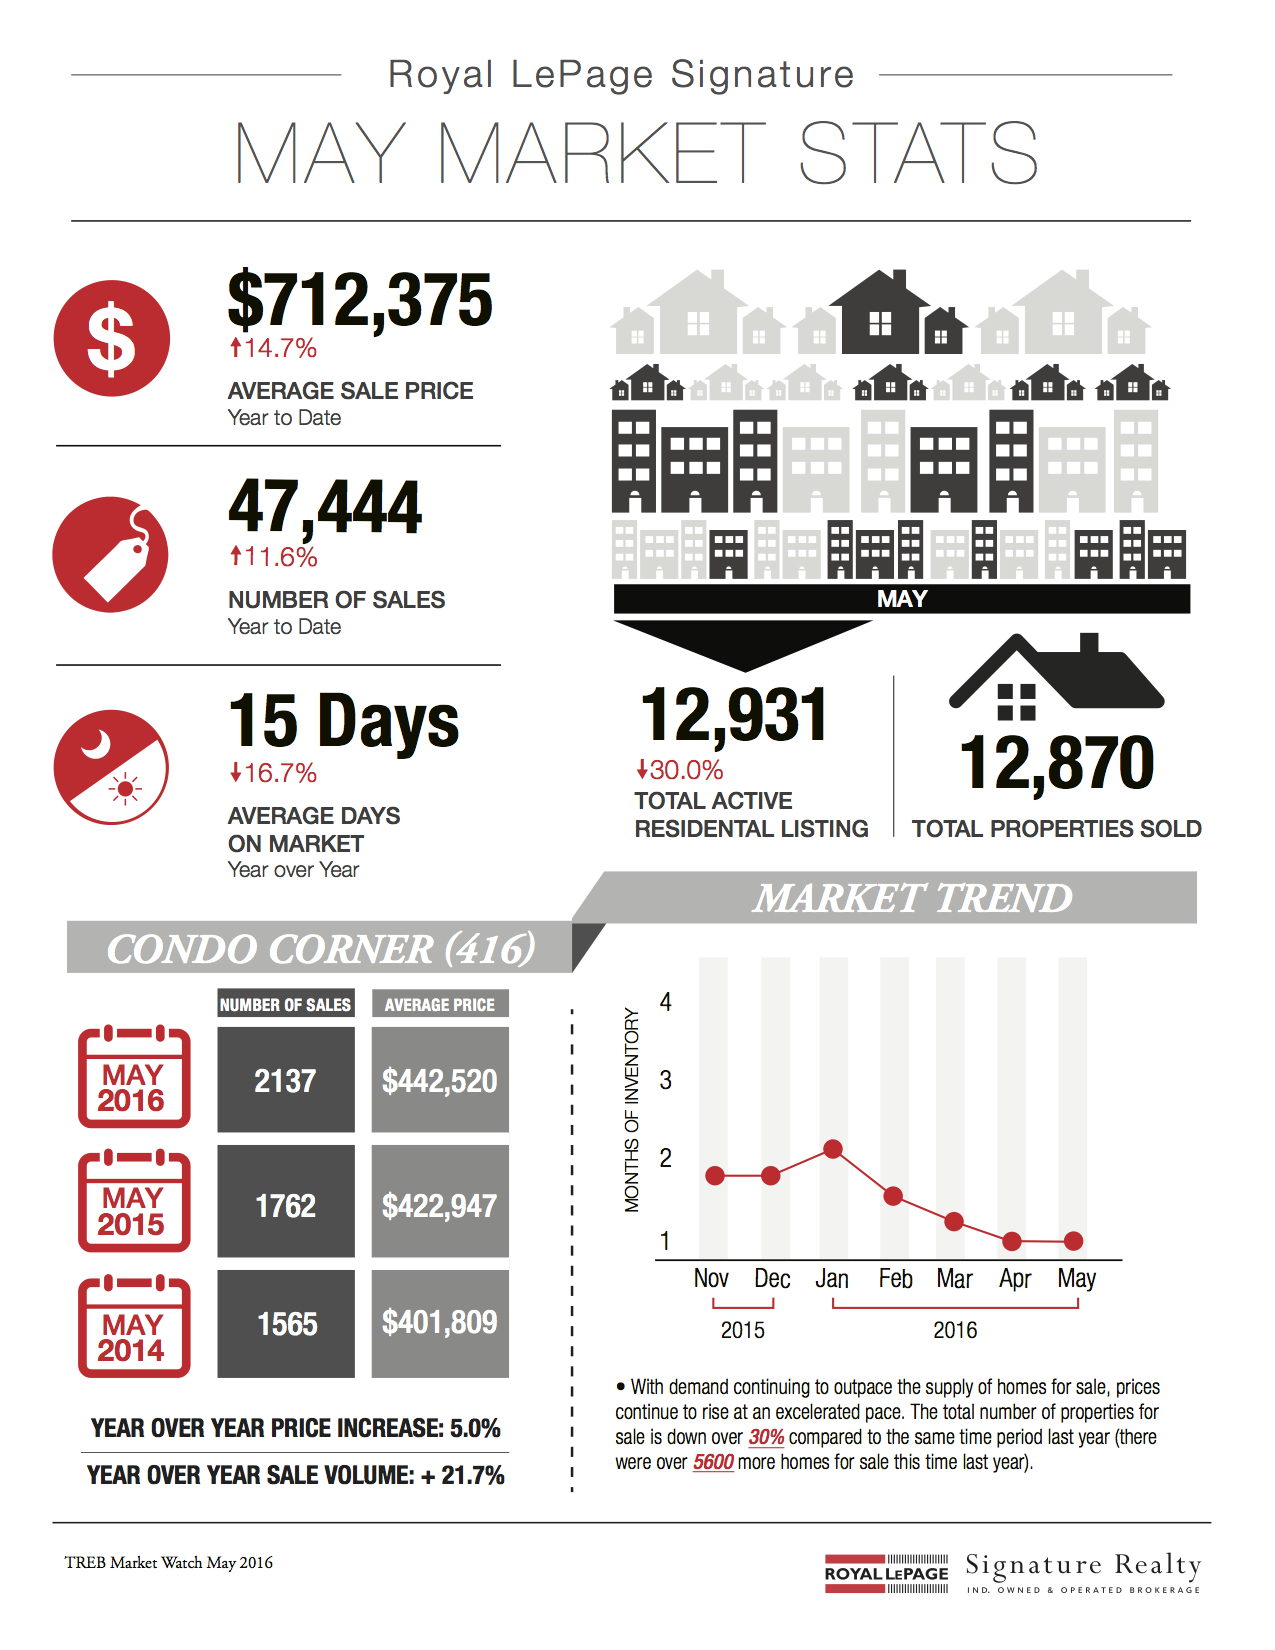 Following is TREB’s market report for May 2016:
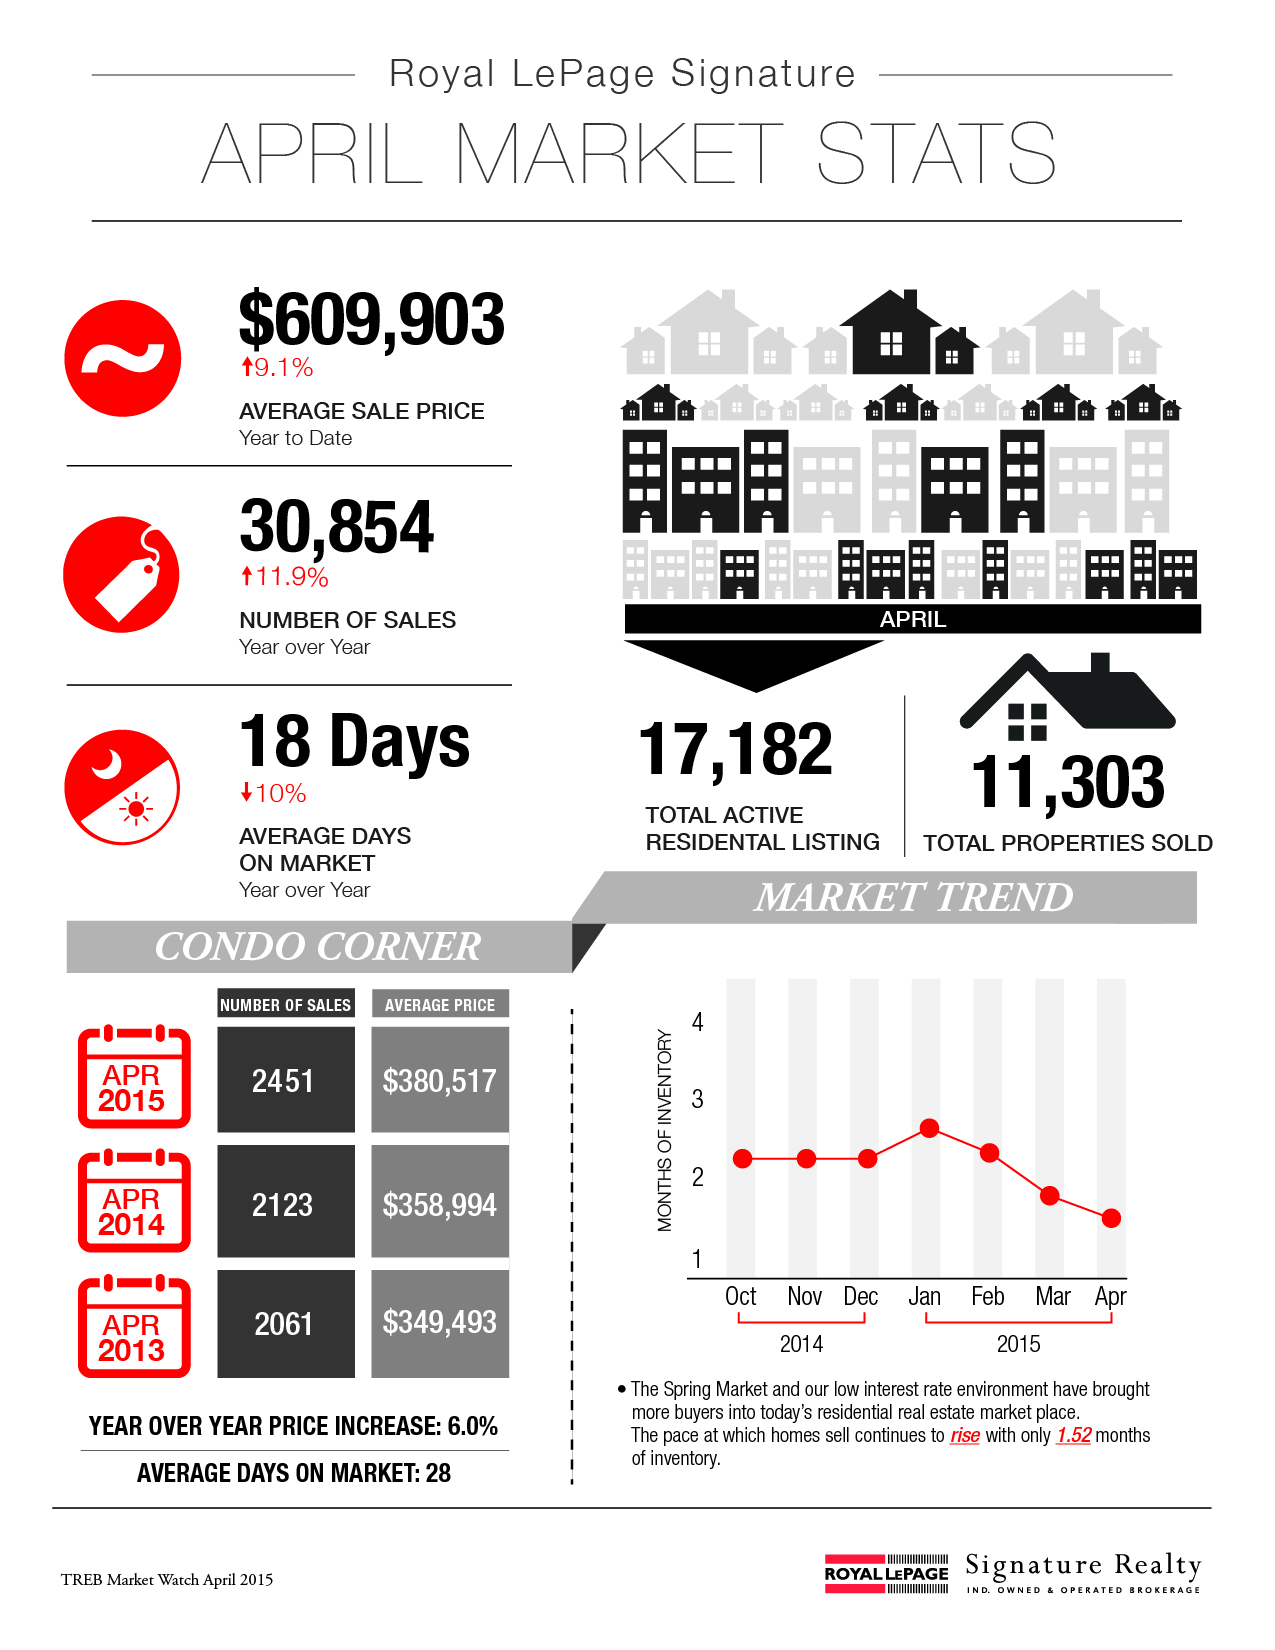
 Following is TREB’s market report for April 2016:
 More than once over the course of these past few months, I've seen a house come on the market and sell for significantly more than what it was unsuccessfully listed at back in the fall/winter.


 Following is TREB's market report for November 2015:

 Following is TREB's market report for September 2015:

 Following is TREB's market report for July 2015: