What A Difference A Season Makes

What A Difference A Season Makes Photo More than once over the course of these past few months, I've seen a house come on the market and sell for significantly more than what it was unsuccessfully listed at back in the fall/winter.

You could argue that this makes sense - that in a rising market a house should sell for more now than it would’ve 6 months ago.

Maybe, maybe not. (More on that towards the end of this blog post).

Regardless, it’s interesting to see such a scenario play out in real time with one specific property.

Here’s a breakdown of what happened with one of the houses I’m referring to:

House is listed in June 2015

Located in a very hot area in the west-end of the city.

Priced at $679,000, with a hold-back on offers.

Offer night comes and goes, and the property doesn’t sell.

They re-list the following day at $719,000, with offers welcome anytime.

After 3 more weeks without selling, they take it off the market.

Same house is re-listed in February 2016

7 months after unsuccessfully trying to sell, they’re back on the market.

Priced again at $719,000, with offers welcome anytime.

In less than 24hrs they receive 3 competing offers and the house sells for $755,000 (105% of list price).

No one wanted the house back in the summer, but by winter’s end there were three buyers tripping over each other to pay well above the asking price.

Wow! What a difference a season (or two) makes.

Does this necessarily mean that the same scenario would play out for every single house listed for sale in the Toronto real estate market right now? Is every single seller out there guaranteed to sell for significantly more if they just wait another 6 months?

Not necessarily. I’m sure there are sellers out there who did better 6 months ago than they would today, for a number of reasons; maybe they were competing with fewer similar listings than they would be today, maybe there were more buyers in the market that week for their particular house than there would be this week, etc.

On the whole though, prices are increasing and you’ll very likely pay more for a house 6 months from now. Just ask the three buyers who bid on the house in my example above.


If you’re thinking of making a move and would like to know how I can help, feel free to contact me for more info.

March 2016 Market Stats: Infographic & Report

March 2016 Market Stats: Infographic & Report Photo

Following is TREB’s market report for March 2016:

Toronto Real Estate Board President Mark McLean announced record TREB MLS® home sales for the first quarter of 2016 following a strong result for March transactions.

There were 10,326 sales in March and 22,575 sales in the first quarter.

The year-over-year growth rate for sales was 15.8 per cent for Q1 2016 and 16.2 per cent for March 2016.

For the TREB market area as a whole, double-digit year-over-year rates of sales growth were experienced for all major home types during the first quarter.

The positive annual growth in sales was not mirrored on the listings front.

The number of new listings entered into TREB's MLS® System during March and the first quarter were down compared to the same periods in 2015.

“At the beginning of 2016, TREB’s outlook for the year pointed to a strong possibility of a second consecutive record year for home sales. This outlook was based, in part, on upbeat consumer survey results pointing to robust home buying intentions. It is clear that these upbeat intentions have translated into record first quarter results,” said Mr. McLean.

The MLS® Home Price Index Composite Benchmark for March 2016 was up by 11.6 per cent compared to March 2015.

The average selling price for all home types combined was up 12.1 per cent year-over-year in March and 13.6 per cent in the first quarter.

“Demand was clearly not an issue in the first three months of 2016, regardless of the housing market segment being considered. The supply of listings, however, continued to aggravate many would-be home buyers. We could have experienced even stronger sales growth were it not for the constrained supply of listings, especially in the low-rise market segments. The resulting strong competition between buyers has underpinned the double-digit rates of price growth experienced so far this year," said Jason Mercer, TREB’s Director of Market Analysis.

If you’re thinking of making a move and would like to know how I can help, feel free to contact me for more info.

For complete copies of TREB’s Monthly Market Watch Reports, visit my archives here.

Did There Really Need To Be 15 Offers?

Did There Really Need To Be 15 Offers? Photo

Did There Really Need To Be 15 Offers? Photo

I was involved in a multiple-offer scenario last week, on a condo townhouse in the east end.

The property had a helluva view, and there was no doubt that it was going to attract plenty of interest and receive a bunch of offers.

“A bunch” ended up being an understatement.

There were 15 offers. FIFTEEN!

The property sold for 125% of the list price (it was listed at $409,000 and sold for $510,000).

With so many offers and such a high sale-to-list price ratio, you have to ask yourself, “Did they really need to under-list the property by that much?”

Couldn’t they have listed at, say, $449,000 (which would still be “underpricing” the property, albeit less drastically)?

While there was obviously one very happy “winner” on offer night, there were 14 other buyers that went home empty handed.

No doubt, some of those buyers went in offering less than $449,000. And despite submitting what they (and/or their realtor) thought was a reasonable offer, they never actually had a chance.

Couldn’t the sellers have been a bit less extreme in their pricing, and perhaps spared a handful of those hopeful buyers on offer night? Wouldn’t they still have ended up with a $510,000 sale price?

Truth be told, there’s no way to know for sure if they would’ve ended up at the same sale price (although I think they would have). Sure, it’s possible that the top offer wouldn’t have come in as high had there only been 7 or 8 offers (unlikely I think, but possible).

On a funny side note, the listing agent had made a point of saying that he felt that there was no need to put anyone through the hassle of going to get a certified cheque ahead of offer night, as it would only add undo stress and waste too many people’s time.

Okay…

But he felt it was reasonable to under-list the property by $75,000 - $100,000? He didn’t think that would result in wasting a bunch of people’s time? Ha!

Granted, the listing agent did a great job for his clients. He orchestrated a process that got them a record-high price for their property.

It’s a frustrating process though, when one happy seller and one happy buyer have to leave 14 other disappointed parties in their wake.

If you’re thinking of making a move and would like to know how I can help, feel free to contact me for more info.

January 2016 Market Stats: Infographic & Report

January 2016 Infographic

Following is TREB’s market report for January 2016:

Toronto Real Estate Board President Mark McLean announced Greater Toronto Area REALTORS® reported 4,672 residential transactions through TREB’s MLS® System in January 2016.

This result represented an 8.2 per cent increase compared to January 2015.

“It is clear that the handoff from 2015 to 2016 was a strong one. This is not surprising given that recent polling conducted for TREB by Ipsos suggested 12 per cent of GTA households were seriously considering the purchase of a home in 2016. Buying intentions are strong for this year as households continue to see home ownership as an affordable long-term investment,” said McLean.

The MLS® Home Price Index Composite Benchmark Price for January 2015 was up by 11.2 per cent on a year-over-year basis.

The average selling price over the same period was up by 14.1 per cent.

The difference in the annual growth rates for the MLS® HPI and average price was largely due to a greater share of high-end detached homes sold in the regions surrounding the City of Toronto this year compared to last.

The MLS® HPI removes the impact of shifts in the share of different property types sold from one year to the next.

“Market conditions in January were tighter compared to a year earlier, with an annual increase in sales up against a decline in listings. This is why growth in the MLS® HPI benchmarks continued to be strong, especially for singles, semis and townhouses, where there has been a persistent lack of inventory,” said Jason Mercer, TREB’s Director of Market Analysis.


If you’re thinking of making a move and would like to know how I can help, feel free to contact me for more info.

For complete copies of TREB’s Monthly Market Watch Reports, visit my archives here.

November 2015 Market Stats: Infographic & Report

November 2015 Market Stats: Infographic & Report Photo Following is TREB's market report for November 2015:

Toronto Real Estate Board President Mark McLean announced that Greater Toronto Area REALTORS® reported 7,385 home sales through TREB’s MLS® System in November 2015 – up by 14 per cent compared to November 2014.

This result also represented the best result on record for the month of November.

Sales through the first eleven months of 2015 amounted to 96,401.

“Not only did we see a record sales result for November, but with one month left to go in 2015, we have already set a new calendar year record for home sales in the TREB market area, eclipsing the previous record set in 2007. Sales were up on a year-over-year basis for all major home types, both in the City of Toronto and surrounding regions. This suggests that the demand for ownership housing is widespread, from first-time buyers to long-time homeowners across the GTA,” said Mr. McLean.

The MLS® Home Price Index (HPI) Composite Benchmark was up by 10.3 per cent year over year in November.

The average selling price for all transactions was also up by a similar annual rate of 9.6 per cent to $632,685.

Annual rates of average price growth for November and the first eleven months of 2015 were similar, with the strongest rates of increase being reported for low-rise home types, including detached and semi-detached houses and townhouses.

“Demand for ownership housing has remained strong in the GTA throughout 2015, with sales generally increasing at a greater annual rate compared to new listings. This means that competition between buyers has strengthened in many neighbourhoods in the City of Toronto and surrounding regions. The end result has been upward pressure on home prices well above the rate of inflation in most cases,” said Jason Mercer, TREB’s Director of Market Analysis.


If you’re thinking of making a move and would like to know how I can help, feel free to contact me for more info.

For complete copies of TREB’s Monthly Market Watch Reports, visit my archives here.

October 2015 Market Stats: Infographic & Report

October 2015 Market Stats: Infographic & Report Photo

Following is TREB's market report for October 2015:

Toronto Real Estate Board President Mark McLean announced that Greater Toronto Area REALTORS® reported 8,804 home sales through TREB’s MLS® System in October 2015.

This is the best result on record for the month of October.

“It is clear that many GTA households remain upbeat about home ownership because owning a home represents a high quality, long-term investment. We will see a big, new record this year for home sales reported through TREB’s MLS® System,” said Mr. McLean.

“Despite the record October result, I must point out that the Government of Ontario could hamper home sales in the near future. The Wynne government is seriously considering allowing municipalities throughout Ontario to institute a second land transfer tax on top of the existing provincial tax. Recent polling has shown that the great majority of Ontarians oppose this tax and would consider delaying a move if they were forced to bear the additional upfront cost,” added Mr. McLean.

The MLS® Home Price Index (HPI) Composite Benchmark was up by 10.3 per cent year over year in October.

Over the same period, the average selling price for all home types combined was up by 7.3 per cent to $630,876.

Price growth continued to be driven by the low-rise market segments.

“Record sales coupled with a constrained supply of listings in many GTA neighbourhoods has underpinned very strong price growth throughout 2015. Even if we do see a greater supply of low-rise listings in the marketplace over the next year, market conditions will remain tight enough to see continued price growth well-above the rate of inflation,” said Jason Mercer, TREB’s Director of Market Analysis.


If you’re thinking of making a move and would like to know how I can help, feel free to contact me for more info.

For complete copies of TREB’s Monthly Market Watch Reports, visit my archives here.

When Should A Seller Consider Accepting A Bully Offer?

 
TAKE_THE_MONEY_AND_RUN_MONOPOLY.jpg
 

When should a seller consider accepting a bully offer?

I am of the opinion that a seller is almost always going to do better if they avoid looking at bully offers, and wait until their scheduled offer night instead.

Every now and then though, a seller finds themselves in a situation where a bully offer is just too damn good to pass up!

Sometimes the price is so phenomenally above what they were expecting to get, that it's just not worth the risk of waiting and ending up with a lower price on offer night.

Sometimes the sellers are seriously stressed out by the entire process of having their home on the market, and the prospect of having it all over-and-done with is a no brainer.

And then there are times where it's actually looking like the home is not going to get the offers that the sellers want/expect on offer night. Case in point...

Earlier this year I had a listing in the west end of the city.

We spent a couple of weeks prepping the property to go on the market, and we decided that the best strategy would be to review offers on a specific date (the following Tuesday after the property initially hit the market).

I actually felt that we were pricing the home at the very top range of what it might be worth, and that we shouldn't necessarily expect to get multiple offers on offer-night. My clients appreciated where I was coming from, but we still felt that a hold-back on offers was the right strategy since comparable homes rarely come up for sale in the area.

Five days into the listing, I received a call from a buyer's agent, saying that her clients wanted to submit a bully offer. My clients were happy to look at it.

Once the offer was registered with my office, I did my duty and reached out to every single agent who had shown the property. And you know what? None of them had clients who were interested in submitting an offer. Not one.

None of them wanted to compete with a bully offer, and in fact, none of them were planning to submit anything on the scheduled offer night either!

It was quickly becoming apparent that this bully offer was probably the only offer we were going to see.

I told my sellers that they were likely going to do much better if we worked with the bully offer that night, as the buyers would be acting under the perceived threat of having to compete with other buyers on offer-night.

We ended up selling the property that night, with only the one offer, for above the list price.

Needless to say, my clients were very happy. The buyers were happy too, as they the secured the home they wanted (who knows if another buyer might've come out of the woodwork on the scheduled offer night and out-bid them?).

Bully offers are a tricky beast, and it's sometimes a tough call on whether or not to to work with them. Sometimes though, it just makes sense to take the money and run!

If you're thinking of selling your home, and you want an agent who knows when you should or shouldn't consider accepting a bully offer, feel free to contact us for more info.

September 2015 Market Stats: Infographic & Report

September 2015 Market Stats: Infographic & Report Photo Following is TREB's market report for September 2015:

Toronto Real Estate Board President Mark McLean announced that Greater Toronto Area REALTORS® reported a record number of transactions for the month of September through TREB’s MLS® System.

There was a combined 8,200 home sales reported for September 2015.

This result was up 2.5 per cent compared to September 2014.

TREB MLS® sales through the first nine months of 2015 amounted to 80,331, which also represented a record result and a 9.5 per cent increase compared to the first three quarters of 2014.

“We are on track for record home sales reported through TREB’s MLS® System this year. Barring a drastic shift in the economy over the next three months, total transactions reported by TREB Members in 2015 are expected to be at or near the 100,000 mark. This is a testament to the importance that GTA households put on home ownership as a long- term investment,” said Mr. McLean.

The MLS® Home Price Index (HPI) Composite Benchmark Price was up by 10.5 per cent year over year.

The average selling price for all home types combined was also up by 9.2 per cent annually to $627,395.

Growth in the MLS® HPI Composite Benchmark and the average price was driven by the low-rise market segments, including detached and semi- detached houses and townhouses.

“While September was the second straight month where annual growth in new listings outstripped annual growth sales, total active listings at the end of the month still remained below last year’s level. This, coupled with the record pace of sales experienced so far this year, suggests that competition between buyers will remain strong as we move into the fourth quarter. Expect strong rates of price growth to continue through the remainder of 2015 and into 2016,” said Jason Mercer, TREB’s Director of Market Analysis.


If you’re thinking of making a move and would like to know how I can help, feel free to contact me for more info.

For complete copies of TREB’s Monthly Market Watch Reports, visit my archives here.

August 2015 Market Stats: Infographic & Report

August 2015 Market Stats: Infographic & Report Photo  

Following is TREB's market report for August 2015:

Toronto Real Estate Board President Mark McLean announced that Greater Toronto Area REALTORS® reported 7,998 residential transactions through the TREB MLS® System in August 2015.

This result represented a 5.7 per cent increase compared to 7,568 sales reported in August 2014.

On a GTA-wide basis, sales were up for all major home types.

The annual growth rate in new listings was greater than the annual growth rate in sales, but active listings at the end of August were still down compared to last year.

This suggests that sellers’ market conditions remained in place, especially where low-rise home types like singles, semis and townhouses were concerned.

“Buyers in the GTA remain confident in their ability to purchase and pay for a home over the long term. They see ownership housing as a quality investment that has historically produced positive returns while at the same time providing owners with a place to live in their chosen community,” said Mr. McLean.

Both the MLS® Home Price Index (HPI) Composite Benchmark and the average selling price for all home types combined were up substantially in August compared to the same period in 2014, with both increasing by approximately 10 per cent year-over-year.

“A record year for home sales continued to unfold in August as competition between buyers exerted upward pressure on selling prices. It was encouraging to see annual growth in new listings outstrip annual growth in sales, but we will need to see this for a number of months before market conditions become more balanced," said Jason Mercer, TREB's Director of Market Analysis.


If you’re thinking of making a move and would like to know how I can help, feel free to contact me for more info.

For complete copies of TREB’s Monthly Market Watch Reports, visit my archives here.


Your Realtor Is Full Of S**t!

Bullshit.jpg

With Labour Day behind us now, the fall real estate market has officially begun!

Just like last year, and the years before that, we're going to see a ton of new listings hit the market this week. And inevitably, some of those listings are going to be overpriced.

There are a handful of reasons why a seller chooses to overprice their home. In this post I want to focus on just one of those reasons: The listing agent lied to the sellers about the true market value of the property.

The Sunshine Approach

The manager at the brokerage where I started my real estate career referred to this as "The Sunshine Approach"; the idea being that the listing agent is "blowing sunshine" up the seller's arse by deliberately overvaluing the home in order to get the listing.

I see it happen all the time. A seller interviews two or three realtors, and ultimately chooses the one who suggests the highest list price. The seller gets stars in their eyes, and is fooled into thinking that the ridiculous list price is actually achievable.

The listing agent's plan is simple: continually work on the seller for price reductions until the home finally sells (almost always for less than market value).

Isn't The Seller Partially To Blame?

Yes, the seller is often partially to blame here. Especially when the other two realtors they interviewed suggested lower list prices (which were no doubt backed-up by tangible market data and past sale prices in the neighbourhood).

Instead, the seller chose to list with the one who came up with the highest number, in spite of what the market data showed.

The seller in this situation sometimes knows, in their gut, that it's too good to be true.  But flattery and the promise of an unprecedented sale price get the better of them.

Have I ever taken an overpriced listing?

Yes, of course I have taken an overpriced listing.

The difference being, the sellers knew from the beginning where I stood on the value of the home.

I made it clear to them that the list price they were choosing was too high, that there were risks involved with overpricing, and that a price reduction would eventually be needed.

It's certainly not the best way to sell a home, but sometimes a seller is determined to "try their price first", even if doing so is going to potentially have a negative impact on the final outcome.

In the end, a seller needs to be realistic and question any advice that sounds too optimistic.

If you're interviewing more than one realtor, be cautious if one of them values your home significantly higher than the others.

A little sunshine is good for your health, but too much will leave you burned.

If you're thinking of making a move and would like an honest valuation of your home, feel free to contact us for more info.

July 2015 Market Stats: Infographic & Report

July 2015 Market Stats: Infographic & Report Following is TREB's market report for July 2015:

Toronto Real Estate Board President Mark McLean announced record home sales for the month of July. Greater Toronto Area REALTORS® reported 9,880 sales through TREB's MLS® System, representing an eight per cent increase compared to July 2014.

The number of transactions were up for all major home types, including a double- digit year-over-year increase in condominium apartment sales.

"As we move towards a new record for home sales this year, it is important to point out that home ownership demand has been driven not only by low borrowing costs, but also by the fact that the GTA economy has been performing quite well, with the unemployment rate lower compared to last year. Home buyers remain confident in the long-term benefits of owning a home," said Mr. McLean.

The MLS® Home Price Index (HPI) Composite Benchmark, which accounts for benchmark home prices in communities throughout the TREB market area, was up by 9.4 per cent year- over-year in July 2015.

Over the same period, the average selling price was up by a slightly greater amount, growing by 10.6 per cent annually to $609,236.

Detached homes continued to lead the way in terms of price increases, with annual growth in the average selling price outstripping growth in the MLS® HPI detached benchmark.

This suggests that there continued to be a greater share of high-end homes sold this year compared to last.

"With the level of inventory in the GTA trending below two months, many listings continued to generate a lot of interest from buyers. Not surprisingly, this supported further price increases well-above the rate of inflation. Assuming similar interest rate and economic environments over the next five months, strong price growth will remain the norm for the rest of 2015," said Jason Mercer, TREB's Director of Market Analysis.


If you’re thinking of making a move and would like to know how I can help, feel free to contact me for more info.

For complete copies of TREB’s Monthly Market Watch Reports, visit my archives here.


April 2015 Market Stats: Infographic & Report

April 2015 Market Stats: Infographic & Report Photo  

Following is TREB's market report for April 2015:

Toronto Real Estate Board President Paul Etherington announced that Greater Toronto Area REALTORS® reported 11,303 sales in April 2015.

This was the highest sales result on record for the month of April and represented a 17 per cent increase in comparison to April 2014.

While sales increased strongly on a year-over-year basis, new listings were up over the same period by a more moderate five per cent.

“The record April result clearly points to the fact that a growing number of GTA households view ownership housing as a high quality long-term investment. This is evidenced by the strong sales growth we have experienced in Toronto and surrounding regions for all major home types. First-time buyers and existing homeowners remain very active in today’s market,” said Mr. Etherington

The overall average selling price, which accounts for all homes reported sold by GTA REALTORS® in April 2015, was up by 10 per cent year-over-year to $635,932.

The MLS® Home Price Index (HPI) composite benchmark, which estimates the price of a benchmark home with the same attributes from one period to the next, was up by 8.4 per cent over the same period.

The fact that average price growth outpaced growth for the MLS® HPI Composite Benchmark, suggests that a greater share of higher-end homes changed hands this year compared to last.

Irrespective of the indicator used, price growth in the GTA was strongest for low-rise home types.

However, the better supplied condominium apartment segment also remained healthy with price growth above the rate of inflation.

“Demand for ownership housing was very high relative to the number of homes available for sale in April. This situation is not expected to change markedly as we move through the remainder of 2015. Until we experience a sustained period in which listings grow at a faster pace than sales, annual rates of home price growth will remain strong,” said Jason Mercer, TREB’s Director of Market Analysis.


If you’re thinking of making a move and would like to know how I can help, feel free to contact me for more info.

For complete copies of TREB’s Monthly Market Watch Reports, visit my archives here.

March 2015 Market Stats: Infographic & Report

March 2015 Market Stats: Infographic & Report Photo  

Following is TREB's market report for March 2015:

Toronto Real Estate Board President Paul Etherington announced that Greater Toronto Area REALTORS® reported 8,940 sales in March 2015.

This result represented an 11 per cent increase compared to March 2014.

Sales were up for most major home types, both in the City of Toronto and the surrounding regions.

New listings were also up, but by a lesser 5.5 per cent, indicating tighter market conditions.

“Home sales increased compared to last year as the cost of home ownership remained affordable, with lower interest rates going a long way to mitigate the effect of rising home prices. However, a substantial amount of pent-up demand remains in place, especially as it relates to low-rise market segments. This suggests that strong competition between buyers, which has fuelled strong price growth so far this year, will continue to be experienced throughout the spring,” said Mr. Etherington.

In March, the average selling price for all reported transactions was $613,933 – up 10 per cent year-over-year.

The MLS® HPI Composite Index, which tracks benchmark homes with the same attributes from one period to the next, was up by 7.9 per cent.

Average price growth was strongest for detached homes in the City of Toronto, at 15.9 per cent.

Over the same period the detached MLS® HPI in the '416' area code increased 7.8 per cent.

The MLS® HPI provides a clear indication of price growth due to market forces - the relationship between demand and supply. Comparing MLS® HPI growth to average price growth provides a sense of the changing mix of home types sold from one period to the next.

"It is clear that seller's market conditions in many parts of the GTA are driving price growth. However, looking at the detached market segment in the City of Toronto in particular, growth in the average selling price outstripped growth in the MLS® HPI. This points to the fact that the mix of detached homes sold this year compared to last has shifted towards more expensive properties," said Jason Mercer, TREB's Director of Market Analysis.


If you’re thinking of making a move and would like to know how I can help, feel free to contact me for more info.

For complete copies of TREB’s Monthly Market Watch Reports, visit my archives here.

February 2015 Market Stats: Infographic & Report

February 2015 Market Stats: Infographic & Report Photo  

Following is TREB’s market report for February 2015:

Toronto Real Estate Board President Paul Etherington announced that Greater Toronto Area REALTORS® reported 6,338 home sales through the TorontoMLS system in February 2015.

This result represented a substantial 11.3 per cent year-over-year increase compared to February 2014.

Large annual increases in transactions were noted for most major home types, in the City of Toronto and surrounding GTA regions.

“Even with the record low temperatures last month, we still saw an increase in the number of people purchasing homes in the GTA. This speaks to the importance households place on home ownership and the fact that buyers continue to view ownership housing as a quality long-term investment in which they can live,” said Mr. Etherington.

The overall supply of homes for sale, as measured by the count of active listings at the end of February 2015, was down by 8.7 per cent compared to the same count in February 2014.

This means that market conditions became tighter, leading to more competition between buyers.

The overall average selling price for February 2015 home sales was $596,163– up by 7.8 per cent compared to the average for February 2014.

Driving this increase was the detached market segment.

In the City of Toronto, the average detached selling price moved above $1 million dollars for the first time in a calendar month.

“The strong year-over-year price growth we experienced in February points to the robust demand for ownership housing in the GTA, coupled with a constrained supply of homes for sale in some market segments, especially where low-rise home types like singles, semis and townhouses are concerned,” said Jason Mercer, TREB’s Director of Market Analysis.

If you’re thinking of making a move and would like to know how I can help, feel free to contact me for more info.

For complete copies of TREB’s Monthly Market Watch Reports, visit my archives here.

January 2015 Market Stats: Infographic & Report

Infographic_JAN_Stats_FEB5_2015_final  

Following is TREB’s market report for January 2015:

Toronto Real Estate Board President Paul Etherington announced a strong start to 2015, with robust year-over-year sales and average price growth in January.

Greater Toronto Area REALTORS® reported 4,355 home sales through the TorontoMLS system during the first month of the year.

This result represented a 6.1 per cent increase over January 2014.

During the same period, new listings were up by 9.5 per cent.

"The January results represented good news on multiple fronts.

First, strong sales growth suggests home buyers continue to see housing as a quality long-term investment, despite the recent period of economic uncertainty.

Second, the fact that new listings grew at a faster pace than sales suggests that it has become easier for some people to find a home that meets their needs," said Mr. Etherington.

The average selling price for January 2015 home sales was up by 4.9 per cent year-over- year to $552,575.

The MLS® Home Price Index (HPI) Composite benchmark was up by 7.5 percent compared to January 2014.

"Home price growth is forecast to continue in 2015.

Lower borrowing costs will largely mitigate price growth this year, which means affordability will remain in check.

The strongest rates of price growth will be experienced for low-rise home types, including singles, semis and town houses.

However, robust end-user demand for condo apartments will result in above-inflation price growth in the high-rise segment as well," said Jason Mercer, TREB's Director of Market Analysis.


If you’re thinking of making a move and would like to know how I can help, feel free to contact me for more info.

For complete copies of TREB’s Monthly Market Watch Reports, visit my archives here.


Toronto Real Estate Market Report: December 2014

Toronto Real Estate Market Report: December 2014 Photo Following is TREB’s market report for December 2014:

Toronto Real Estate Board President Paul Etherington announced that Greater Toronto REALTORS® reported 92,867 residential sales through the TorontoMLS system in 2014, including 4,446 in December.

The calendar year 2014 sales result represented a 6.7 per cent increase over the 2013 sales figure of 87,049 and was just short of the record set in 2007.

"TREB's 2014 sales figures are a testament to the importance Greater Toronto Area households continue to place on home ownership.

GTA households realize that home purchases have been a quality long-term investment.

While home prices certainly increased substantially in 2014, the purchase of an average priced home remained affordable, in terms of the average household's ability to comfortably cover their monthly mortgage payments," said Mr. Etherington.

"Even with a constrained supply of homes for sale in many parts of the Greater Toronto Area, buyers continued to get deals done last month.

Households remain upbeat about home ownership because monthly mortgage payments remain affordable relative to accepted lending standards.

This is coupled with the fact that housing has proven to be a quality long-term investment," stated Mr. Etherington.

The average selling price continued to grow on a year-over-year basis in calendar year 2014, with an 8.4 per cent increase over calendar year 2013 to $566,726.

This included a seven per cent increase in the December 2014 average selling price to $556,602.

Throughout 2014, annual increases in the average selling price and the MLS® HPI Composite Benchmark were consistently reported on a monthly basis for most market segments, from detached homes through to condominium apartments.

"The strong price growth we experienced in 2014 can be explained with two words: listings shortage.

The constrained supply of listings was especially evident for low-rise home types like singles, semis and town houses.

The number of households looking to purchase these home types increased, while the number of homes from which they could choose decreased.

This situation resulted in more competition between buyers and more aggressive offers," said Jason Mercer, TREB's Director of Market Analysis.


Toronto Real Estate Market Report: December 2014 Photo


If you’re thinking of making a move and would like to know how I can help, feel free to contact me for more info.

For complete copies of TREB’s Monthly Market Watch Reports, visit my archives here.

Toronto Real Estate Market Report: November 2014 Statistics

Toronto Real Estate Market Report: November 2014 Statistics Photo 
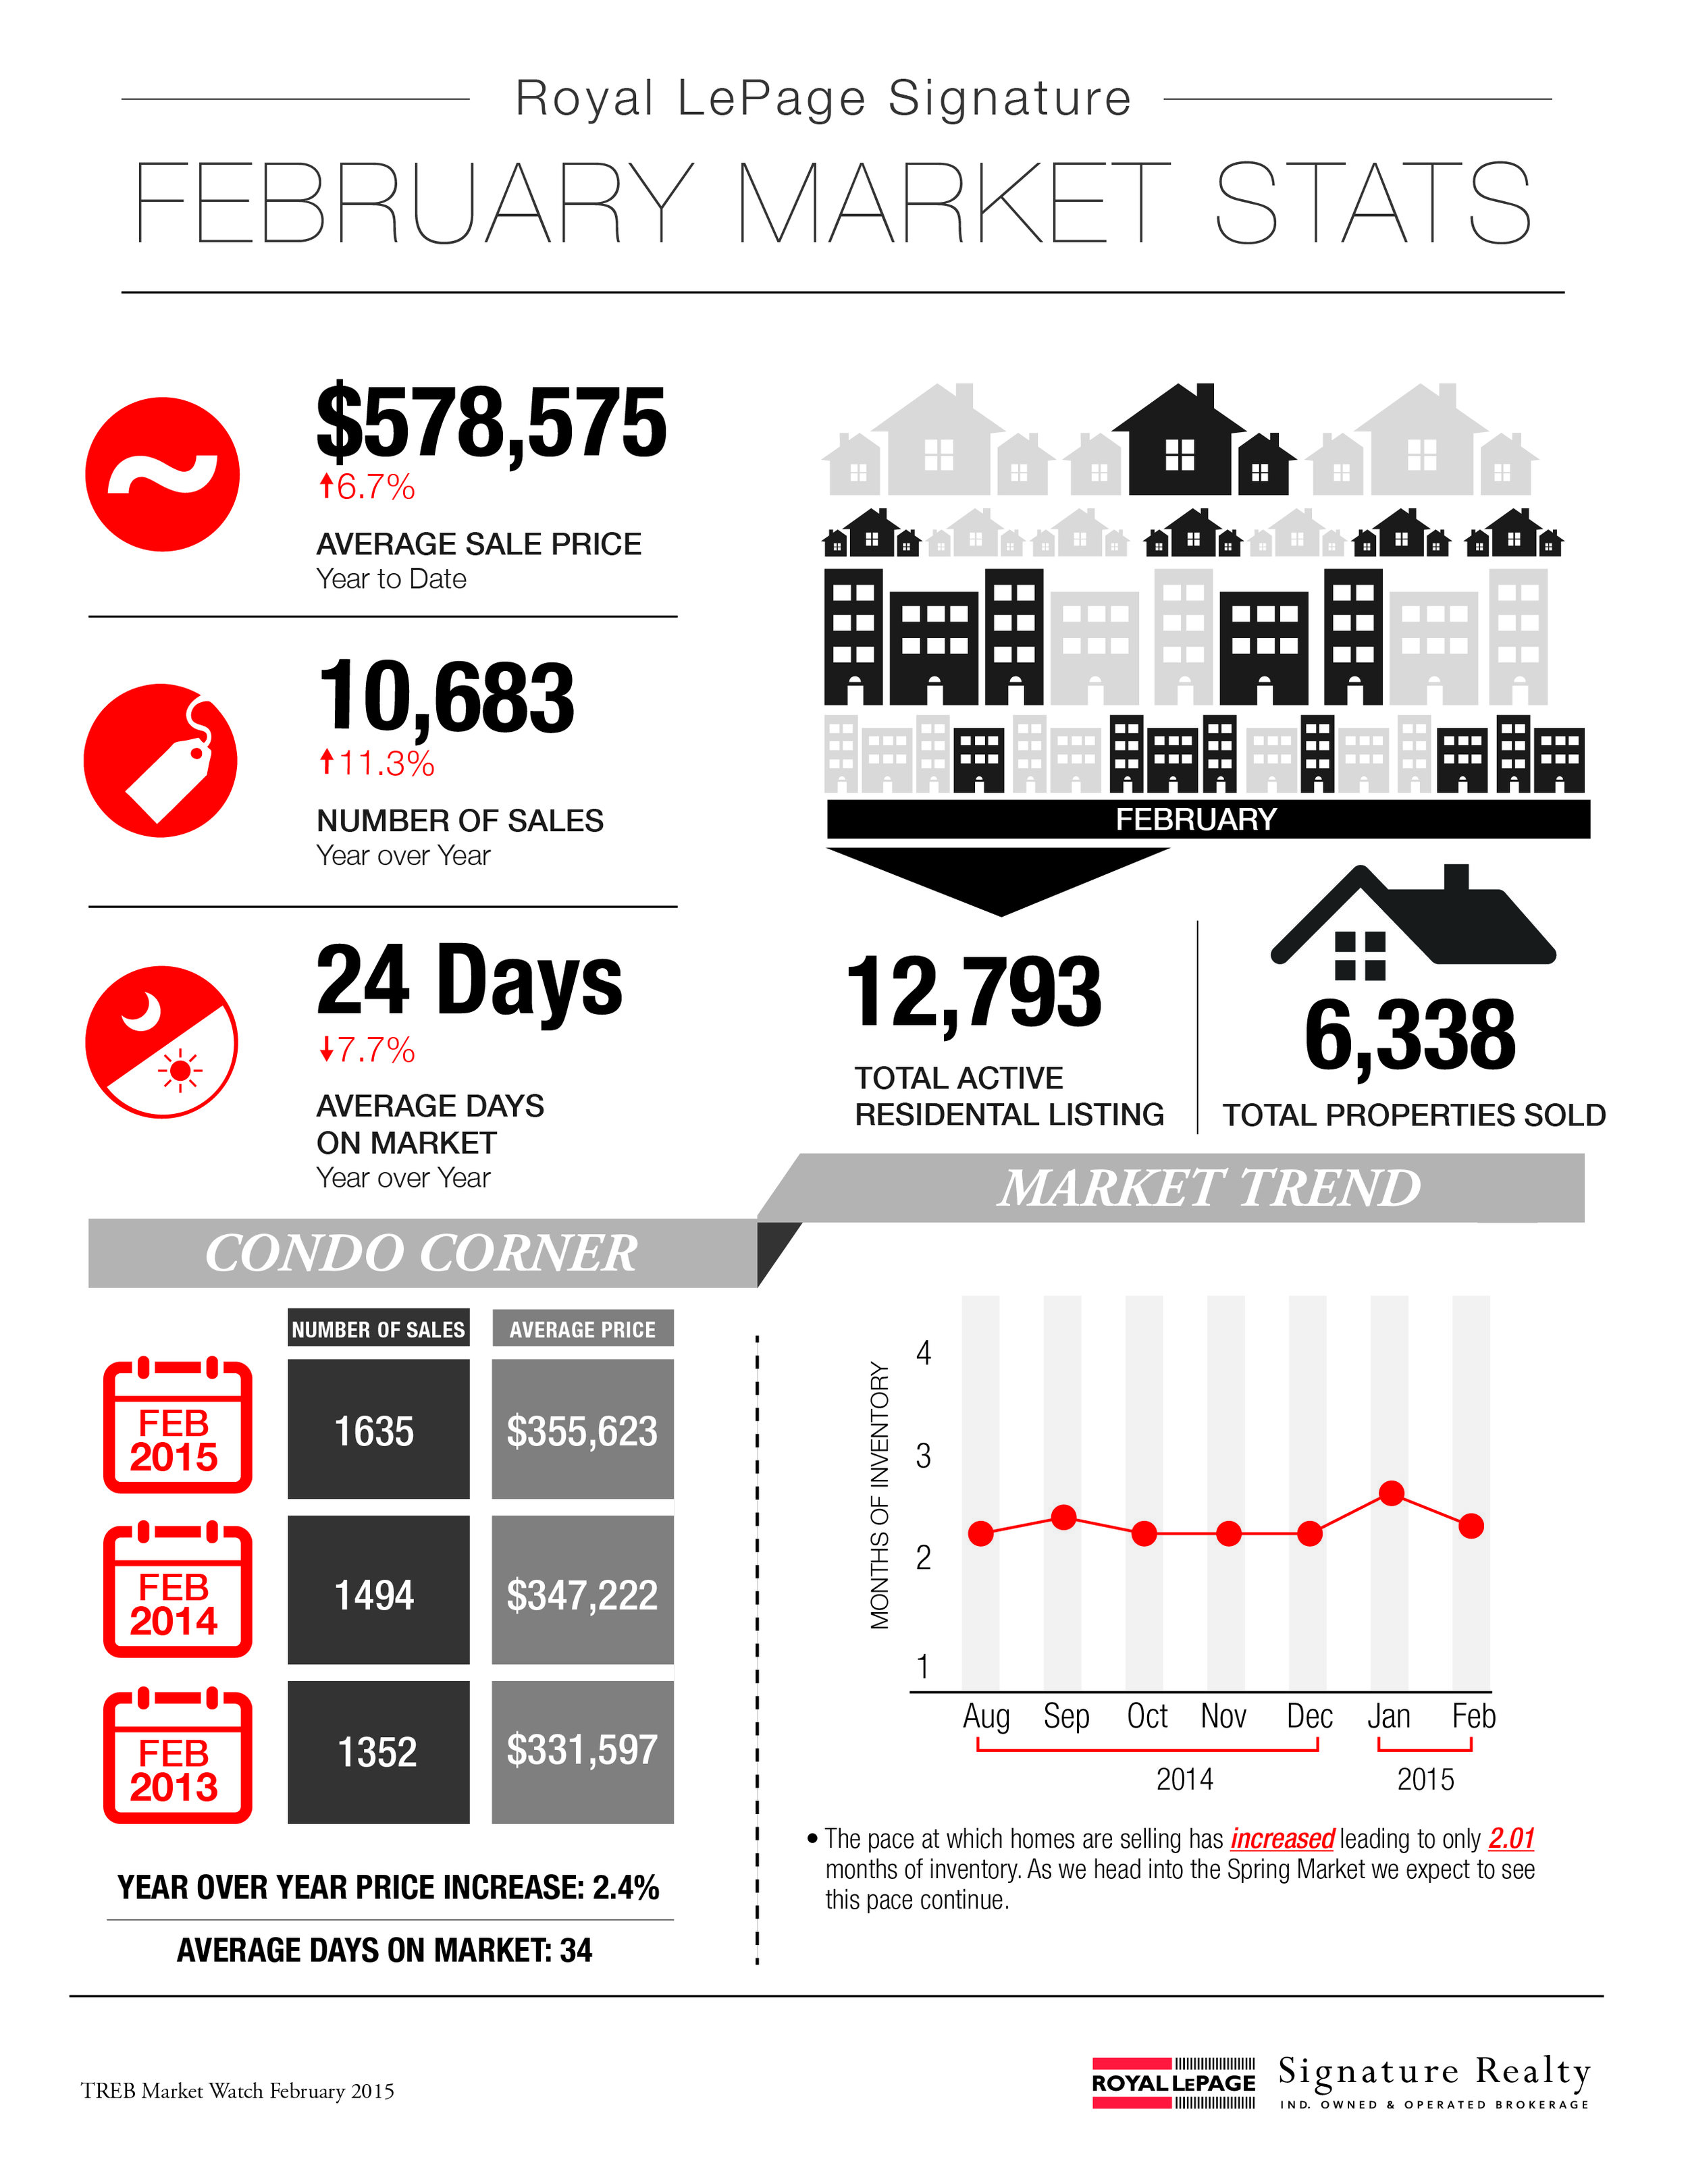
Following is TREB’s market report for November 2014:

Toronto Real Estate Board President Paul Etherington announced that Greater Toronto REALTORS® reported 6,519 residential transactions through the TorontoMLS system in November 2014.

This result was up by 2.6 per cent compared to 6,354 sales reported in November 2013.

Through the first 11 months of 2014, total sales amounted to 88,462 - up 6.6 per cent compared to the same period in 2013.

While the trend of year-over-year sales growth continued, the supply of listings remained constrained, with active listings at the end of November down in comparison to last year.

"Even with a constrained supply of homes for sale in many parts of the Greater Toronto Area, buyers continued to get deals done last month.

Households remain upbeat about home ownership because monthly mortgage payments remain affordable relative to accepted lending standards.

This is coupled with the fact that housing has proven to be a quality long-term investment," stated Mr. Etherington.

The average selling price for November transactions was up by 7.4 per cent year-over-year to $577,936.

The year-to-date average price was up by 8.4 per cent to $567,198.

The MLS(R) Home Price Index Composite Benchmark price for November was up by 7.7 per cent compared to a year earlier.

"The robust average price growth experienced throughout 2014 has been fundamentally sound, with demand high relative to supply.

Strong competition between buyers has exerted upward pressure on selling prices.

Barring a substantial shift in the relationship between sales and listings in the GTA, price growth is expected to continue through 2015," said Jason Mercer, TREB's Director of Market Analysis.


Toronto Real Estate Market Report: November 2014 Statistics Photo


If you’re thinking of making a move and would like to know how I can help, feel free to contact me for more info.

For complete copies of TREB’s Monthly Market Watch Reports, visit my archives here.

What Happens When A Seller Receives Zero Offers?

Zero Offers! | Toronto Condos | Toronto Lofts | Toronto Real Estate 
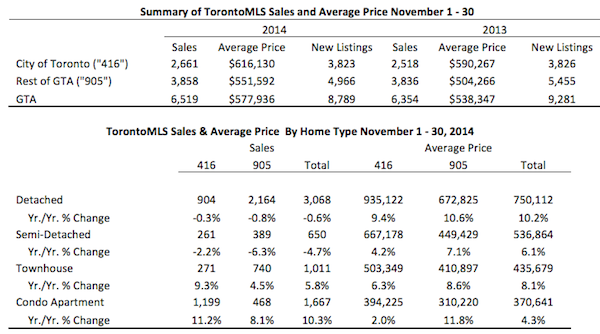
Back in August I wrote about the sellers who received 7 competing offers on offer-night, and said "no" to all of them (read it here). (Update: That house didn't sell and is now off the market.)

This month I'd like to take a look at what happens when a seller receives no offers on offer-night...

I was recently out with some clients, viewing houses for sale in the west-end of the city.

We saw six houses in total, and each one had a scheduled offer-night for the following week.

Four of those houses ended up selling on offer-night (with multiple-offers, and sale prices well above what they were listed at).

The other two houses didn't sell.

In fact, those two houses didn't receive any offers at all!

So, what options does a seller have when they receive zero offers on offer-night?

Generally, a seller will respond in one of three ways:

Response #1 - Hold Your Ground

In this case, the seller believes that the property is priced where it should be. Despite the fact that they received no offers, they're going to hold their ground and keep the list price where it is.

Response #2 - Raise The Price

Here, the seller believes that the property was underpriced initially (as part of a strategy to create a multiple-offer scenario, and an above-list sale price).

The strategy didn't pan-out on offer-night, so they terminate the listing on mls and re-list the next day at a price that's more in-line with what they're hoping to sell for.

Response #3 - Lower The Price

Here, the seller believes that receiving no offers means the property is over-priced.

They don't want to waste any more time on the market, so they respond swiftly with a reduction in price.

Truthfully, we don't see this third response very often. A seller will usually hold their ground for a few more weeks before considering a price reduction.

Response #2 (raising the price) is the one we see most often. But it doesn't always work (take a look at the greedy sellers from my August blog post as an example).

Keep in mind, these are only the three most common seller responses. There are actually others as well.

I've even seen listings receive zero offers on offer-night, then turn around and try the exact same strategy all over again: re-list the next day, at the same price, with a new offer-night...

...and it worked!


If you’re thinking of making a move and would like to know how I can help, feel free to contact me for more info.

Toronto Real Estate Market Report: September 2014 Statistics

Toronto Real Estate Market Report: September 2014 Statistics Photo Following is TREB’s market report for September 2014:

Toronto Real Estate Board President Paul Etherington announced that there were 8,051 transactions reported through the TorontoMLS system in September 2014.

This result represented a 10.9 per cent increase compared to September 2013.

On a year-to-date basis through the first three quarters of the year, sales were up by 6.9 per cent annually to 73,465.

"Despite a persistent shortage of listings in some market segments, we have experienced strong growth in sales though the first nine months of 2014.

This is evidence that GTA households remain upbeat about purchasing a home.

The majority of home buyers purchase a home using a mortgage.

The share of the average household's income dedicated to their mortgage payment remains affordable, which is why buyer interest has remained solid," said Mr. Etherington.

The average selling price for September 2014 transactions was $573,676 – up by 7.7 per cent compared to the same period in 2013.

Average year-over-year price growth was strongest in the City of Toronto, both for low-rise home types like detached and semi-detached houses and for condominium apartments.

The average selling price year-to-date was $563,813 – up 8.5 per cent compared to the first nine months of 2013.

"If the current pace of sales growth remains in place, we could be flirting with a new record for residential sales reported by TREB Members this year.

On the pricing front, the multitude of willing buyers in the marketplace coupled with the short supply of listings will continue to translate into very strong annual rates of price growth in the fourth quarter," said Jason Mercer, TREB's Director of Market Analysis.


Toronto Real Estate Market Report: September 2014 Statistics Photo


If you’re thinking of making a move and would like to know how I can help, feel free to contact me for more info.

For complete copies of TREB’s Monthly Market Watch Reports, visit my archives here.

Toronto Real Estate Market Report: August 2014 Statistics

Toronto Real Estate Market Report: August 2014 Statistics Photo 
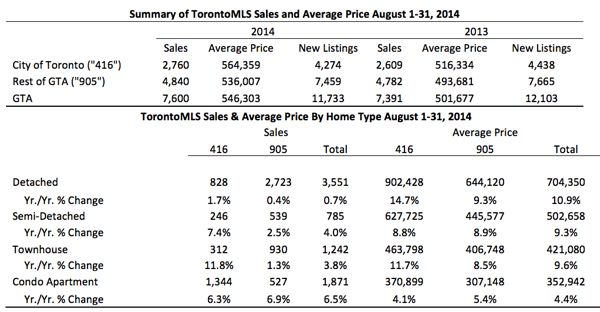
Following is TREB’s market report for August 2014:

Toronto Real Estate Board President Paul Etherington reported 7,600 sales through the TorontoMLS system in August 2014.

This result was up by 2.8 per cent compared to 7,391 transactions reported in August 2013.

Year-to-date sales through the end of August amounted to 65,454, which represented an increase of 6.5 per cent compared to the same period in 2013.

“The last full month of summer ended on a high note. As we look toward the fall market, I expect that demand for ownership housing will remain strong.

Home buyers will continue to benefit from a diversity of affordable home ownership opportunities throughout the GTA.

The fact that sales were up for all major home types in August suggests that first-time buyers and existing home owners remain very active in today’s marketplace,” said Mr. Etherington.

The average selling price in August 2014 was $546,303 – up 8.9 per cent in comparison to the average of $501,677 reported in August 2013.

The year-to-date average price through August was $562,504, which represented an increase of 8.5 per cent in comparison to the same period in 2013.

“The number of listings in August was down in comparison to last year, while the number of sales increased. This means that sellers’ market conditions remained in place with a lot of competition between buyers.

This is why we continued to see strong price growth last month.

Looking forward, if sales growth continues to outstrip listings growth, the average selling price should continue to increase on a year-over-year basis,” said Jason Mercer, TREB’s Director of Market Analysis.


Toronto Real Estate Market Report: August 2014 Statistics Photo


If you’re thinking of making a move and would like to know how I can help, feel free to contact me for more info.

For complete copies of TREB’s Monthly Market Watch Reports, visit my archives here.