October 2022 Market Stats


October 2022 market stats are here!

The residential real estate market continues to adjust and prices seem to have hit a consistent threshold where the average sale price of all home types in October is almost equal to September's average price ($1,089,428 and $1,086,762 respectively). 

The active number of listings has seen the greatest change, up 68% compared to the same month last year.  At the end of October there were over 13,000 homes available for sale, there were only 7,750 at this same time last year.

Another figure we watch is the number of monthly sales, down just over 49%.  Last October there were exactly 9,783 homes sold, this October there were 4,961.  With rising interest rates, fewer homes are being sold and inventory levels have begun to rise, putting downward pressure on prices, down almost 6% compared to October last year. 

No one likes to see the value of their home depreciate, however, the positive outlook in situations like this is that the months of available homes for sale continue to remain low with only 2.63 month of available inventory.  If another home, of any type, was not to come up for sale the GTA would be sold out of residential real estate in under three months.  A city the size of ours needs a lot of inventory to really see a major shift in prices as we simply do not have the inventory of available homes to currently do that.

Condominium sales continue to remain constant, appreciating 2% compared to October of last year.  Even with the volume of trades down almost 60% for this home type, condominiums continue to be an affordable way to own real estate in this great city.

If you’re thinking of making a move and would like to know how we can help, please contact us for more info.

September 2022 Market Stats: Infographics & Report


September 2022 market stats are here!

With the arrival of the Fall season, there have been some changes to the Greater Toronto Area's residential real estate market. The most dramatic changes have occurred to the volume of sales, there have been 44% fewer trades this September compared to last September. However, the average price of all home types is only down 4% compared to the same time period.

Prices have begun to adjust but not as drastically as one may have thought in relation to the rise of mortgage rates. Inventory levels increased by 47% compared to last September, up to a total of 13,534. Historically speaking this number is still not enough to cool the continued interest in real estate.

With annual immigration numbers being between 400,000 to 500,000 per year for the foreseeable future, the supply of homes will continue to be limited.

The rental market has continued to be very busy. With borrowing costs increasing more buyers have chosen to sit on the sidelines in hopes to wait out the rate increases or to see if prices will continue to adjust down.

With continued limits on the amount of homes for sale and strong immigration numbers, pricing will continue to adjust slowly or stay flat compared to previous years as the market gets used to the new interest rate environment.

If you’re thinking of making a move and would like to know how we can help, please contact us for more info.

Sellers: Should You Have A Pre-Listing Home Inspection Done?

Home-Inspect-1.jpg

Before listing a house for sale, we always advise our seller clients to have a pre-listing home inspection done (and we pay for it).

In our experience it's best for everyone involved (the sellers, the buyers, and the realtors) to know the condition of the home before an offer is presented.

Any reasonable buyer is going to make their offer conditional on having a home inspection anyway, so why not nip potential problems in the bud?

If we're holding back offers on the property, then having a pre-listing home inspection is even more essential.

Sure, buyers who are planning on participating on offer night have the option of getting their own pre-offer home inspection done.

But not everyone is keen on spending $500 and a few hours of their time on a property that they might not even end up getting.

I've seen plenty of buyers decide to “sit this one out” and not participate on offer night because there was no pre-listing home inspection available.

Although there are plenty of home inspection companies in the city of Toronto, Carson Dunlop & Associates Ltd. is the go-to choice for many and they do a pretty good job of explaining the pre-listing home inspection themselves...

Following is an excerpt from the "Home Seller's Inspection" page on Carson Dunlop & Associates' website:

Why A Pre-Listing Home Inspection Makes So Much Sense:

With a traditional buyer’s (or pre-purchase) inspection, the buyer and seller negotiate the terms of the sale and agree on price. The sale is conditional on a home inspection. At the inspection the buyer finds out what condition the home is in. It sounds a little backwards already, doesn’t it? Why would you buy something before you know what shape it’s in?

The buyer gets the report, finds out the home is not perfect (none are) and feels they have overpaid. They want to re-negotiate, or worse, they want out of the transaction. The real estate sales professionals are in an awkward spot, because they have already sold the home, going through a tough negotiation. Now they have to tell the seller that the buyer wants a lower price. The sales process has to start over again, or the deal falls apart. Neither side is happy.

When the condition of the home is disclosed before the inspection, there are no surprises. It’s as simple as that.

Why is it not always done this way? Because of the way home inspection has grown. When there were no home inspections, this was not an issue. When home inspection was in its infancy, sellers hoped that buyers would not ask for an inspection. But now, virtually all buyers want an inspection. The game has changed. Sellers now understand that there will be an inspection, and it may well cause a problem. Rather than sit by and desperately hope for the best, sellers can control the situation.

Benefits of a Pre-Listing Inspection:

  1. Everyone knows the condition of the home, and there are no 11th hour surprises.

  2. No home is perfect and a good inspection report will provide that perspective.

  3. If there are issues raised that need a second opinion or further evaluation, that can happen before the house is listed, rather than in the middle of a high stress negotiation.

  4. Sellers can make improvements or reflect the condition in the listing price. (We prefer the latter.)

  5. Buyers are more comfortable making an offer, because they know what they are getting.

  6. In competitive situations, prospective buyers may not make an offer because they are not able to get an inspection, or the odds are high that the money spent on an inspection will be wasted. A seller’s inspection may allow more potential buyers to make an offer.

In today’s environment, with buyers getting home inspections, the seller is very wise to have the inspection done before the house goes on the market.

If you’re thinking of making a move and would like to know how I can help, feel free to contact us or more info.

June 2020 Market Stats: Infographics & Report


June 2020 market stats are here!

The average sale price in the GTA for the month was $930,869, up 11.9% compared to June 2019.

Here’s a breakdown of the June 2020 average sale prices & year-over-year increases/decreases for the 416 area code:

  • Detached = $1,523,770 (+14.3%)

  • Semi-Detached = $1,287,832 (+22.0%)

  • Townhouse = $855,339 (+6.2%)

  • Condo Apartment = $672,465 (+5.6%)

And here’s TREB’s official market report for the month of June 2020:

Toronto Regional Real Estate Board President Lisa Patel announced that Greater Toronto Area REALTORS® reported 8,701 sales through TRREB’s MLS® System in June 2020.

This result represented a very substantial increase over the May 2020 sales result, both on an actual (+89 per cent) and seasonally adjusted basis (+84 per cent), and was only down by 1.4 per cent compared to June 2019.

Year-over-year growth in sales was reported in some areas and market segments.

Especially notable were the detached and townhouse market segments in the GTA regions surrounding the City of Toronto.

New listings were up slightly on a year-over-year basis by 2.1 per cent.

However, active listings on TRREB’s MLS® System at the end of June 2020 were down by 28.8 per cent compared to June 2019.

Growth in new listings will need to outstrip growth in sales for a number of months before active listings approach last year’s levels.

The MLS® Home Price Index Composite Benchmark was up by 8.2 per cent year-over-year in June.

The average selling price for all home types combined was $930,869 – up by 11.9 per cent compared to June 2019.

The actual and seasonally-adjusted average selling price was also up substantially compared to May 2020, by 7.8 per cent and 9.8 per cent respectively.

Average and benchmark selling prices were up year-over-year for all major home types.

The strongest average annual rates of price growth were experienced in the detached and semi-detached market segments in the City of Toronto at 14.3 per cent and 22 per cent respectively.

This, coupled with the fact that average selling price growth outstripped growth in the MLS® HPI benchmarks, points to a resurgence in the higher-end market segments.

If you’re thinking of making a move and would like to know how we can help, please contact us or more info.

February 2020 Market Stats: Infographics & Report

 
FEB - GTA.jpg

FEB - TORONTO.jpg
 

February 2020 market stats are here!

The average sale price in the GTA for the month was $910,290, up 16.7% compared to February 2019.

Here’s a breakdown of the February 2020 average sale prices & year-over-year increases/decreases for the 416 area code:

  • Detached = $1,485,304 (+14.4%)

  • Semi-Detached = $1,208,073 (+10.6%)

  • Townhouse = $846,465 (+10.5%)

  • Condo Apartment = $722,675 (+18.0%)

And here’s TREB’s official market report for the month of February 2020:

In line with the forecast contained in the Toronto Regional Real Estate Board’s recently released Market Year in Review and Outlook Report, TRREB President Michael Collins announced a very strong year-over-year sales and price growth in February 2020.

Greater Toronto Area REALTORS® reported 7,256 residential transactions through TRREB’s MLS® System in February 2020, representing a 45.6 per cent increase compared to a 10-year sales low in February 2019.

However, February 2020 sales were still below the 2017 record result.

Year-over-year sales growth, for the GTA as a whole, was strongest for ground-oriented home types.

After preliminary seasonal adjustment, February 2020 sales also exhibited positive momentum, up by 14.8 per cent compared to January 2020.

New listings amounted to 10,613 in February 2020, a 7.9 per cent increase compared to February 2019.

This moderate annual growth rate was much smaller than that reported for sales, which means market conditions tightened considerably over the past year.

As market conditions tightened over the past year, competition between buyers has clearly increased.

This resulted in a further acceleration in year-over-year price growth in February.

The MLS® Home Price Index Composite Benchmark was up by 10.2 per cent.

The average selling price for all home types combined was up by 16.7 per cent to $910,290.

Double-digit average price growth was experienced for most major market segments, including detached houses and condominium apartments.

If you’re thinking of making a move and would like to know how we can help, please contact us or more info.

January 2020 Market Stats: Infographic & Report

 
GTA.jpg

Toronto.jpg
 

January 2020 market stats are here!

The average sale price for the month was $839,363, up 12.3% compared to January 2019.

Here’s a breakdown of the January 2020 average sale prices & year-over-year increases/decreases for the 416 area code:

  • Detached = $1,369,848 (+16.7%)

  • Semi-Detached = $1,004,208 (+1.1%)

  • Townhouse = $782,274 (-1.9%)

  • Condo Apartment = $679,182 (+15.0%)

And here’s TREB’s official market report for the month of January 2020:

TRREB President Michael Collins announced that Greater Toronto Area REALTORS® reported 4,581 home sales through TRREB’s MLS® System in January 2020 – up by 15.4 per cent compared to January 2019.

On a preliminary seasonally adjusted basis, sales were up by 4.8 per cent compared to December 2019.

“We started 2020 where 2019 left off, with very strong growth in the number of sales up against a continued dip in the number of new and available listings. Tighter market conditions compared to a year ago resulted in much stronger growth in average selling prices. Steady population growth, low unemployment and low borrowing costs continued to underpin substantial competition between buyers in all major market segments,” said Mr. Collins.

The MLS® HPI Composite Benchmark price was up by 8.7 per cent compared to January 2019 – the highest annual rate of growth for the Benchmark since October 2017.

The condominium apartment market segment continued to lead the way in terms of MLS HPI® price growth, but all home types experienced price growth above seven per cent when considering the TRREB market area as a whole.

The average selling price in January was up by 12.3 per cent, driven by the detached and condominium apartment segments in the City of Toronto.

“A key difference in the price growth story in January 2020 compared to January 2019 was in the low-rise market segments, particularly with regard to detached houses. A year seems to have made a big difference. It is clear that many buyers who were on the sidelines due to the OSFI stress test are moving back into the market, driving very strong year-over-year sales growth in the detached segment. Strong sales up against a constrained supply continues to result in an accelerating rate of price growth,” said Jason Mercer, TRREB’s Director of Market Analysis and Service Channels.

If you’re thinking of making a move and would like to know how we can help, please contact us or more info.

December 2019 Market Stats: Infographic & Report

 
1 - RLPS_Infographic_Stats_Let_Jan8_2020_01_GTA (1).jpg

RLPS_Infographic_Stats_Let_Dec4_2019_02_TORONTO.jpg
 

December 2019 market stats are here!

The average sale price for the month was $837,788, up 11.9% compared to December 2018.

Here’s a breakdown of the December 2019 average sale prices & year-over-year increases/decreases for the 416 area code:

  • Detached = $1,363,357 (+19.5%)

  • Semi-Detached = $1,004,477 (+6.9%)

  • Townhouse = $717,369 (+0.4%)

  • Condo Apartment = $656,233 (+10.3%)

And here’s TREB’s official market report for the month of December 2019:

Toronto Real Estate Board President Michael Collins reported that December 2019 residential sales reported through TREB’s MLS® System by Greater Toronto Area REALTORS® were up by 17.4 per cent year-over-year to 4,399.

Total sales for calendar year 2019 amounted to 87,825 – up by 12.6 per cent compared to the decade low 78,015 sales reported in 2018.

On an annual basis, 2019 sales were in line with the median annual sales result for the past decade.

“We certainly saw a recovery in sales activity in 2019, particularly in the second half of the year. As anticipated, many home buyers who were initially on the sidelines moved back into the market place starting in the spring. Buyer confidence was buoyed by a strong regional economy and declining contract mortgage rates over the course of the year,” said Mr. Collins.

While sales were up in 2019, the number of new listings entered into TREB’s MLS® System was down by 2.4 per cent year-over-year.

For the past decade, annual new listings have been largely in a holding pattern between 150,000 and 160,000, despite the upward trend in home prices over the same period.

“Over the last ten years, TREB has been drawing attention to the housing supply issue in the GTA. Increasingly, policy makers, research groups of varying scope and other interested parties have acknowledged that the lack of a diverse supply of ownership and rental housing continues to hamper housing affordability in the GTA. Taking 2019 as an example, we experienced a strong sales increase up against a decline in supply. Tighter market conditions translated into accelerating price growth. Expect further acceleration in 2020 if there is no relief on the supply front,” said Jason Mercer, TREB’s Chief Market Analyst.

The MLS® Home Price Index Composite Benchmark was up by 7.3 per cent on a year-over-year basis in December 2019.

From June 2019 onward, the annual growth rate in the MLS® HPI Composite Benchmark accelerated.

The average selling price in December 2019 was $837,788 – up almost 12 per cent year-over-year.

For calendar year 2019, the average selling price was $819,319 – up by four per cent compared to $787,856 in 2018.

If you’re thinking of making a move and would like to know how we can help, please contact us or more info.

November 2019 Market Stats: Infographic & Report

 
RLPS_Infographic_Stats_Let_Dec4_2019_01_GTA.jpg

RLPS_Infographic_Stats_Let_Dec4_2019_02_TORONTO.jpg
 

November 2019 market stats are here!

The average sale price for the month was $843,637, up 7.1% compared to November 2018.

Here’s a breakdown of the average sale prices & year-over-year increases/decreases for the 416 area code:

  • Detached = $1,360,246 (+4.9%)

  • Semi-Detached = $1,067,027 (+0.3%)

  • Townhouse = $763,298 (+3.2%)

  • Condo Apartment = $659,855 (+10.9%)

And here’s TREB’s official market report for the month of November 2019:

Toronto Real Estate Board President Michael Collins announced that Greater Toronto Area REALTORS® reported 7,090 sales through TREB's MLS® System in November 2019 – a 14.2 per cent increase compared to November 2018.

On a GTA-wide basis, sales were up year-over-year for all major market segments.

Annual sales growth in ground oriented home types, including detached houses, led the way. 

New listings entered into TREB's MLS® System in November and the active listings count at the end of the month went in the opposite direction compared to last year, with new listings down 17.9 per cent year-over-year and active listings down 27.2 per cent. 

"An increasing number of home buyers impacted by demand-side policies over the past three years, including the 2017 Ontario Fair Housing Plan and the OSFI mortgage stress test, have moved back into the market for ownership housing. Based on affordability and stricter mortgage qualification standards, many buyers may have likely adjusted their preferences, changing the type and/or location of home they ultimately chose to purchase," said Mr. Collins. 

As market conditions continued to tighten in November 2019, with increased sales up against an increasingly constrained supply of listings, the annual rate of price growth continued to accelerate.

The MLS® Home Price Index Composite Benchmark increased by 6.8 per cent year-over-year.

The average selling price increased by 7.1 per cent year-over-year to $843,637. Both the MLS® HPI and the average selling price for the TREB market area as a whole experienced the strongest annual rates of price growth for the year in November. 

"Strong population growth in the GTA coupled with declining negotiated mortgage rates resulted in sales accounting for a greater share of listings in November and throughout the second half of 2019. Increased competition between buyers has resulted in an acceleration in price growth. Expect the rate of price growth to increase further if we see no relief on the listings supply front," said Jason Mercer, TREB's Chief Market Analyst.

If you’re thinking of making a move and would like to know how we can help, please contact us or more info.

October 2019 Market Stats: Infographic & Report

 
Unknown.jpeg

Unknown-1.jpeg
 

October 2019 market stats are here!

The average sale price for the month was $852,142, up 5.5% compared to October 2018.

Here’s a breakdown of the average sale prices & year-over-year increases/decreases for the 416 area code:

  • Detached = $1,323,015 (+1.1%)

  • Semi-Detached = $1,099,802 (+7.1%)

  • Townhouse = $795,115 (+3.5%)

  • Condo Apartment = $662,631 (+9.6%)

And here’s TREB’s official market report for the month of October 2019:

Toronto Real Estate Board President Michael Collins announced that Greater Toronto Area REALTORS® reported 8,491 residential sales through TREB’s MLS® System in October 2019.

This result represented a 14 per cent increase compared to 7,448 sales reported in October 2018.

GTA-wide, sales were up on a year-over-year basis for all major home types.

“A strong regional economy obviously fuels population growth. All of these new households need a place to live and many have the goal of purchasing a home. The problem is that the supply of available listings is actually dropping, resulting in tighter market conditions and accelerating price growth,” said Mr. Collins.

The trend of annual growth in sales versus annual decline in new listings continued in October 2019, with new listings down by 9.6 per cent compared to October 2018.

The resulting tighter market conditions compared to a year ago resulted in positive annual rates of price growth across all major market segments, from a GTA-wide perspective.

The MLS® Home Price Index Composite Benchmark was up by 5.8 per cent on a year-over-year basis in October 2019 – the strongest annual rate of growth since December 2017.

The average selling price for all home types combined was up by 5.5 per cent to $852,142, compared to $807,538 in October 2018.

“As market conditions in the GTA have steadily tightened throughout 2019, we have seen an acceleration in the annual rate of price growth. While the current pace of price growth remains moderate, we will likely see stronger price growth moving forward if sales growth continues to outpace listings growth, leading to more competition between home buyers,” said Jason Mercer, TREB’s Chief Market Analyst.

If you’re thinking of making a move and would like to know how we can help, please contact us or more info.

September 2019 Market Stats: Infographic & Report

 
September 2019 - GTA.jpg

September 2019 - Toronto.jpg
 

September 2019 market stats are here!

The average sale price for the month was $843,115, up 5.8% compared to September 2018.

Here’s a breakdown of the average sale prices & year-over-year increases/decreases for the 416 area code:

  • Detached = $1,360,623 (+1.2%)

  • Semi-Detached = $1,069,119 (+7.0%)

  • Townhouse = $785,890 (+5.7%)

  • Condo Apartment = $636,817 (+3.3%)

And here’s TREB’s official market report for the month of September 2019:

Toronto Real Estate Board President Michael Collins announced that Greater Toronto Area REALTORS® reported 7,825 sales through TREB’s MLS® System in September 2019.

This result represented strong year-over-year sales growth of 22 per cent compared to 6,414 sales reported in September 2018.

It is important to note, however, that sales remain well-below the record September 2016 peak of more than 9,800 sales.

On a preliminary seasonally adjusted basis, the September 2019 sales level remained in virtually the same as the August 2019 result.

The supply of listings continued to be a concern in September 2019, with new listings down by 1.9 per cent year-over-year to 15,611.

We have experienced multiple months this year wherein the annual rate of sales growth outpaced the annual rate of new listings growth, resulting in the overall number of active listings at month-end being well-below last year’s levels.

This speaks to tightening market conditions and an accelerating annual rate of price growth.

The annual rate of price growth in September reached the highest point so far in 2019.

The MLS® Home Price Index (HPI) Composite Benchmark was up by 5.2 per cent on a year-over-year basis in September.

The average selling price for all home types combined was up by a similar annual rate of 5.8 per cent to $843,115.

On a preliminary seasonally adjusted basis, the September 2019 average selling price was up by 1.2 per cent compared to August 2019.

If you’re thinking of making a move and would like to know how we can help, please contact us or more info.

August 2019 Market Stats: Infographic & Report

 
August 2019 - GTA.jpg

August 2019 - Toronto.jpg
 

August 2019 market stats are here!

The average sale price for the month was $792,611,755, up 3.6% compared to August 2018.

Here’s a breakdown of the average sale prices & year-over-year increases/decreases for the 416 area code:

  • Detached = $1,246,392 (+0.3%)

  • Semi-Detached = $956,411 (+7.3%)

  • Townhouse = $712,934 (+4.1%)

  • Condo Apartment = $619,307 (+5.7%)

And here’s TREB’s official market report for the month of August 2019:

Toronto Real Estate Board President Michael Collins announced that Greater Toronto Area REALTORS® reported 7,711 residential sales through TREB’s MLS® System in August 2019.

This result represented a 13.4 per cent increase compared to 6,797 sales reported in August 2018.

On a month- over-month basis, after preliminary seasonal adjustment, sales were up by 0.8 per cent.

GTA-wide sales were up on a year-over-year basis for all major market segments, with annual rates of sales growth strongest for low-rise home types including detached houses.

This reflects the fact that demand for more expensive home types was very low in 2018 and has rebounded to a certain degree in 2019, albeit not back to the record levels experienced in 2016 and the first quarter of 2017.

Market conditions also became tighter in August 2019 compared to a year ago because, while sales were up year-over-year, new listings were down by three per cent over the same time period to 11,789. Year-to-date, growth in sales has well outstripped growth in new listings.

This is why overall active listings counted at the end of August were down by more than 11 per cent compared to August 2018.

The MLS® Home Price Index Composite Benchmark for August 2019 was up by 4.9 per cent on a year-over-year basis.

The average selling price, at $792,611 in August 2019, was up by 3.6 per cent year-over-year.

Both the MLS® HPI benchmark prices and average selling prices were up on an annual basis for major market segments.

The condominium apartment segment continued to lead the way in terms of price growth, followed by higher density low-rise home types and finally detached houses.

If you’re thinking of making a move and would like to know how we can help, please contact us or more info.

July 2019 Market Stats: Infographic & Report

 
July 2019 - GTA.jpeg

July 2019 - Toronto.jpeg
 

July 2019 market stats are here!

The average sale price for the month was $806,755, up 3.2% compared to July 2018.

Here’s a breakdown of the average sale prices & year-over-year increases/decreases for the 416 area code:

  • Detached = $1,227,301 (-9.1%)

  • Semi-Detached = $981,802 (+5.0%)

  • Townhouse = $755,401 (+5.5%)

  • Condo Apartment = $627,927 (+7.7%)

And here’s TREB’s official market report for the month of July 2019:

Toronto Real Estate Board President Michael Collins announced that Greater Toronto Area REALTORS® reported 8,595 sales through TREB’s MLS® System in July 2019.

This result was up by 24.3 per cent compared to July 2018.

On a month-over-month basis, sales were up by 5.1 per cent, after preliminary seasonal adjustment.

New listings entered into TREB’s MLS® System in July 2019 were up compared to July 2018, but by a much lesser annual rate than sales, at 3.7 per cent. With annual growth in sales far outstripping annual growth in new listings, market conditions clearly tightened compared to last year.

Active listings at the end of July were down by 9.1 per cent year-over-year, further reflecting tightening market conditions.

As market conditions continued to tighten in July, the average selling price increased by 3.2 per cent on a year-over-year basis to $806,755.

The MLS® Home Price Index Composite benchmark was up by 4.4 per cent. Higher density home types continued to drive price growth, whereas detached home prices remained down in many communities throughout the GTA.

Broadly speaking, increased competition between buyers for available properties has resulted in relatively strong price growth above the rate of inflation for semi-detached houses, townhouses and condominium apartments.

However, the single-detached market segment, which has arguably been impacted most by the OSFI stress test, has experienced a slower pace of price growth, with average detached prices remaining lower than last year’s levels in some parts of the GTA.

If you’re thinking of making a move and would like to know how we can help, please contact us or more info.

The August Slow-Down

Turtle.jpg

Toronto's real estate market is exceptionally active.

On any given day listings are being uploaded to MLS, realtors are out viewing properties with clients, and offers are being signed.

It seems as though the Toronto real estate market never sleeps.

It does take a breather though. Twice a year.

Once during the holiday season (late-December/early-January). And again during the 2nd half of summer (the month of August).

Things are noticeably slower as these are the two times of year when a relatively large portion of the real estate market (buyers, sellers, and realtors) are away on vacation.

Even those buyers who aren't away on an actual vacation are likely still taking a break from their home search.

Accordingly, many sellers (and listing agents) feel that once August hits it's probably best to hold-off until after Labour Day to list.

We can't say we disagree.

We met with a couple of perspective sellers just a few weeks ago and, after some discussion, both decided to wait until September to sell.

And our current buyer clients are in the mind-set of, "If something great becomes available in the next few weeks let's go take a look. But realistically I'm not expecting to find anything until the market picks up again in September."

There are always two sides to the coin though. And in some instances August can actually be a great time to buy and/or sell.

We’'ve written a few articles in the past that are worth a read here:

  1. Are There Deals To Be Had In The Last Few Weeks Of Summer? (read it here)

  2. Why Wait Until After Labour Day To List Your Home For Sale? (read it here)

  3. Is It Better To Wait Until After Labour Day To List Your Home For Sale? (read it here)

Whether you decide to stay active or take a break from the market this August is up to you. We know we'll be working the majority of the month, so if you got any questions just give us a shout. If not, enjoy the rest of your summer and we'll see you in September!

If you’re thinking of making a move and would like to know how we can help, please contact us for more info.

June 2019 Market Stats: Infographic & Report

 
RLPS_Infographic_Stats_Let_July4_2019_1 GTA.jpg

RLPS_Infographic_Stats_Let_July4_2019_2 TORONTO.jpg
 

June 2019 market stats are here!

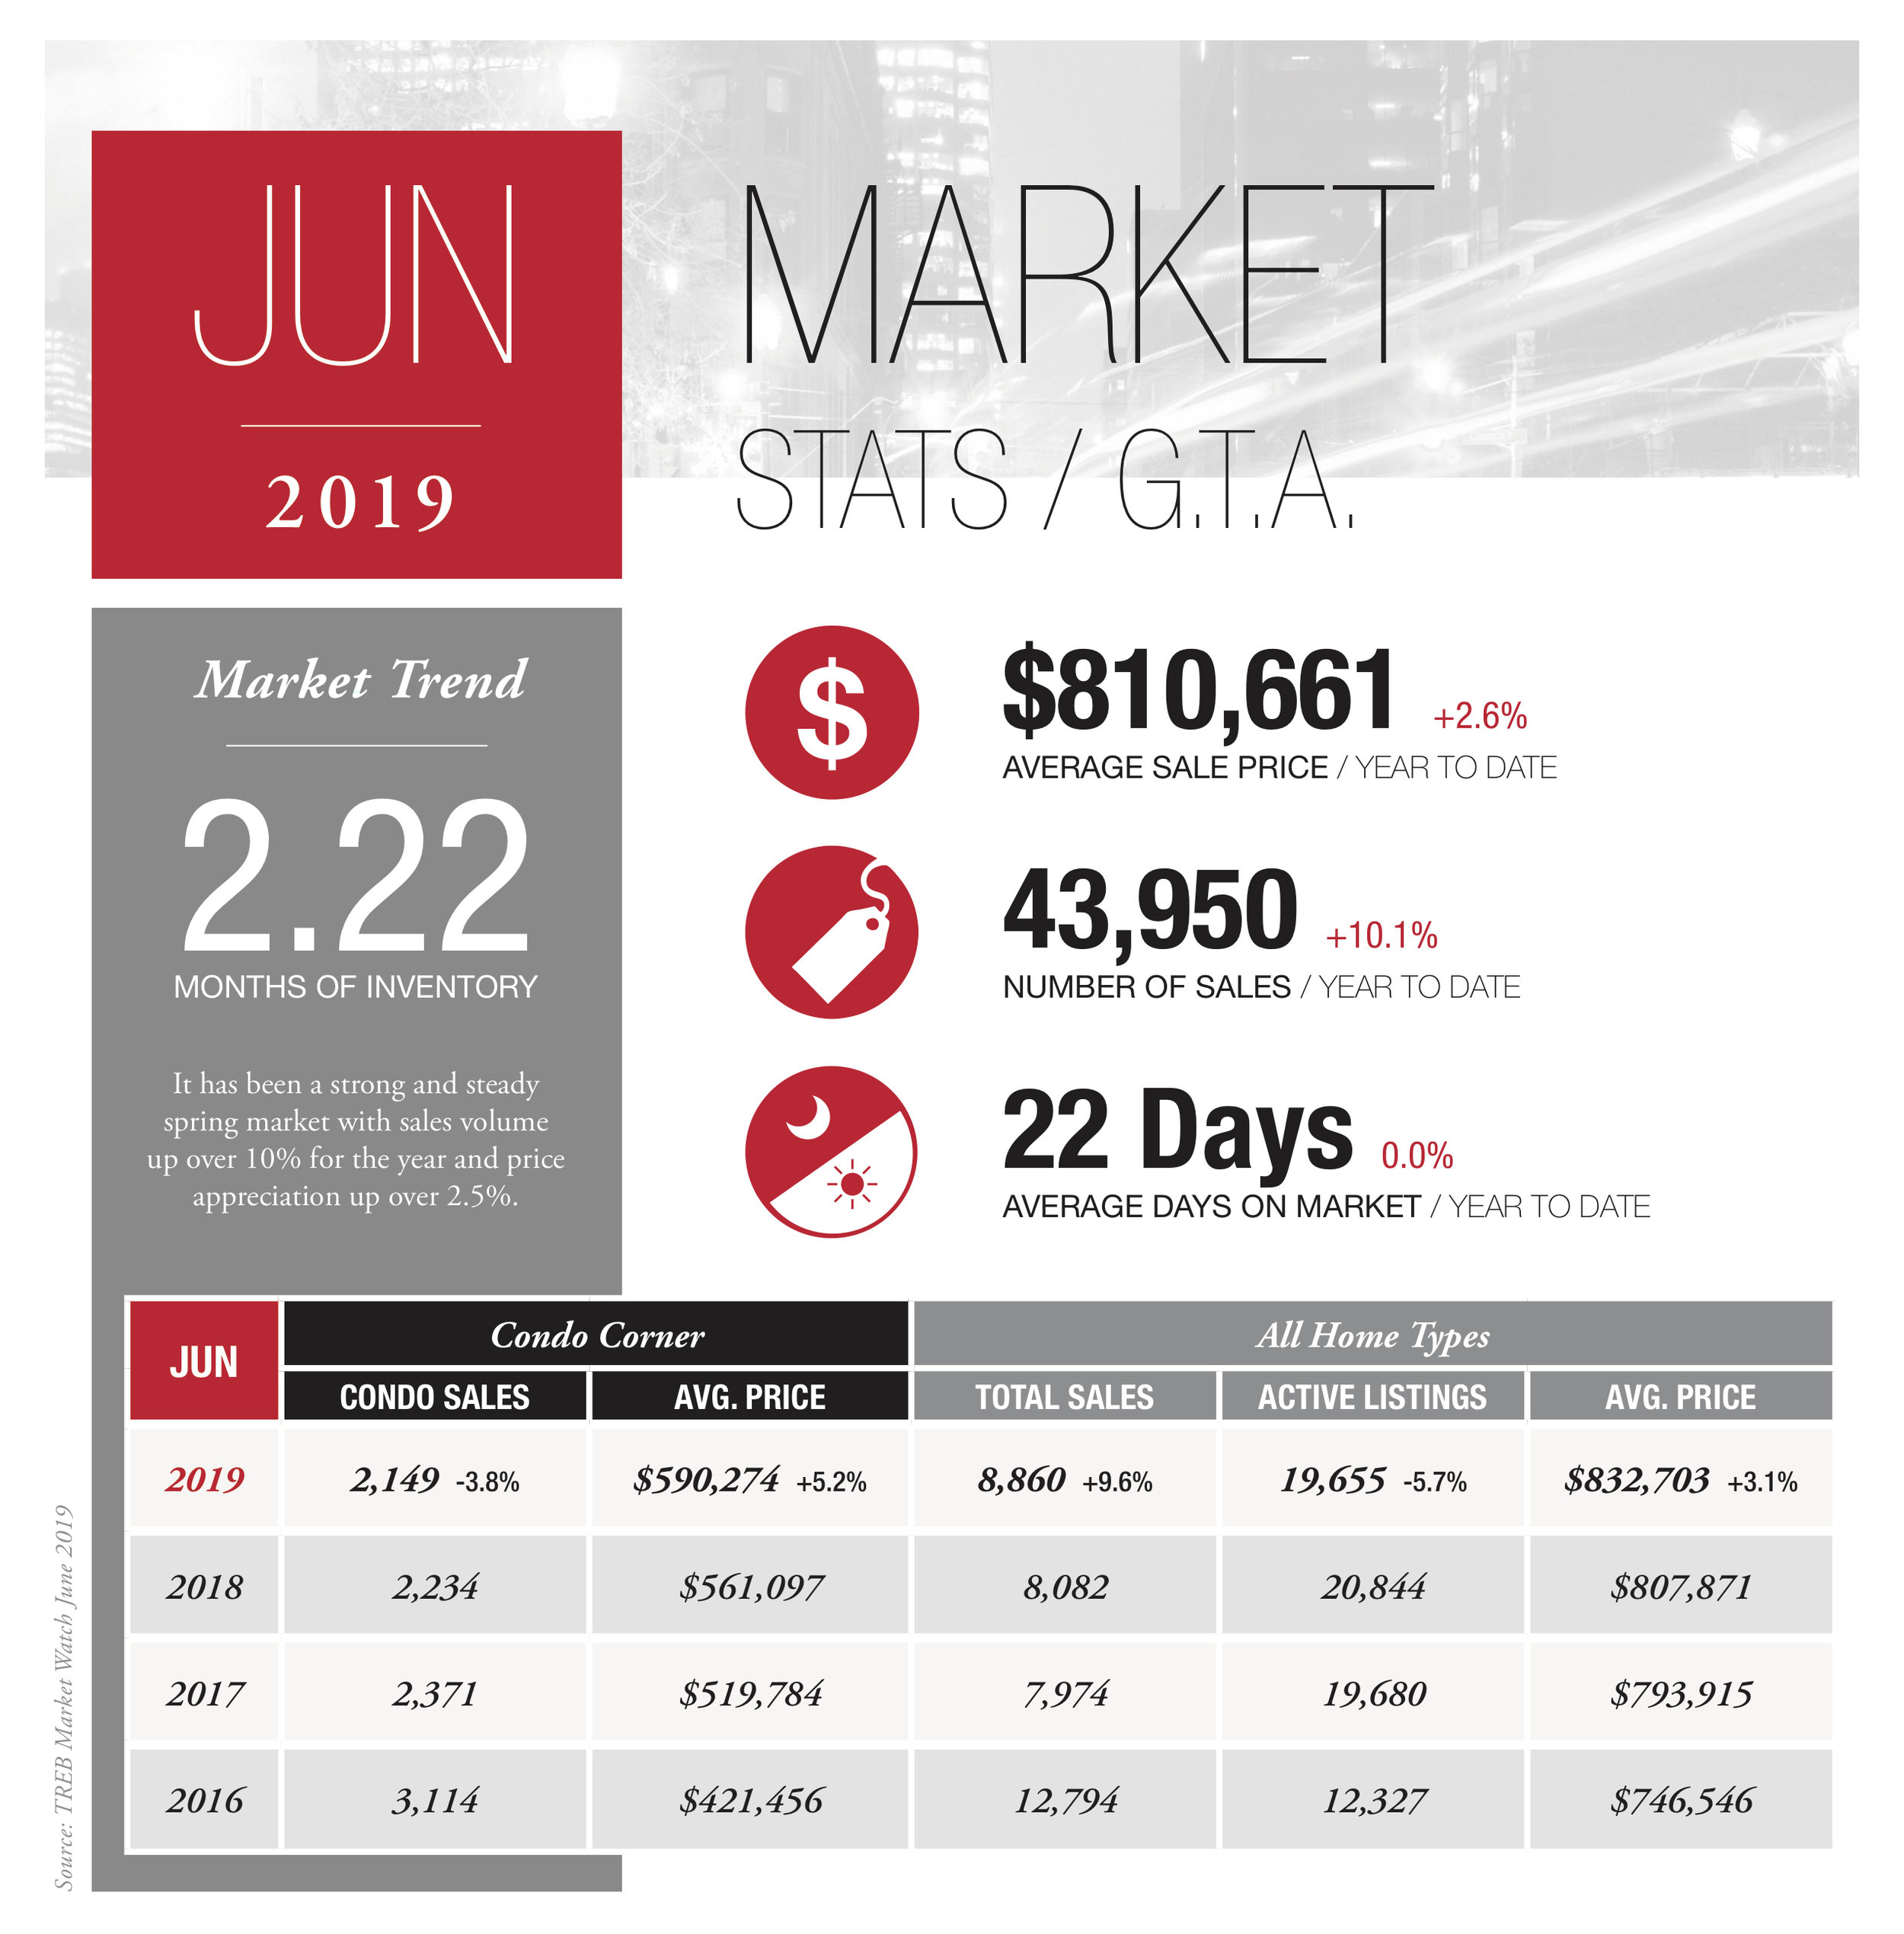
The average sale price for the month was $832,703, up 3.0% compared to June 2018.

Here’s a breakdown of the average sale prices & year-over-year increases/decreases for the 416 area code:

  • Detached = $1,332,639 (-1.6%)

  • Semi-Detached = $1,055,423 (+5.4%)

  • Townhouse = $810,039 (+9.2%)

  • Condo Apartment = $636,606 (+5.1%)

And here’s TREB’s official market report for the month of June 2019:

The new President of the Toronto Real Estate Board, Michael Collins, announced that Greater Toronto Area REALTORS® reported 8,860 sales through TREB's MLS® System in June 2019, representing a 10.4 per cent increase compared to June 2018.

Over the same time period, total new listings remained at a similar level for the month of June and active listings at month-end were down by 5.7 per cent.

Sales and new listings statistics for the first half of 2019 compared to the same period in 2018 painted a similar story to that of June.

Sales were up by 8.5 per cent, while new listings were up by less than one per cent.

This shows that sales accounted for a greater share of listings compared to last year, which means that competition between buyers increased, resulting in renewed price growth in many segments of the market.

"As I start my term as President of the Toronto Real Estate Board, I am proud to say that the Greater Toronto Area continues to grow, in terms of employment, population and overall diversity. As people are attracted to our region from all around the world, they obviously need a place to live. Over the next year, as demand for ownership and rental housing continues to grow, my hope is that we will see more movement from policy makers on two fronts: alleviating the constrained supply of housing and providing more flexibility around demand-side policies, including the OSFI two percentage point mortgage stress test and allowable amortization periods on insured mortgages," said Mr. Collins.

The overall average selling price in June 2019 was $832,703 – up by three per cent compared to the average of $808,066 in June 2018.

Price growth was driven by the higher density market segments, including semi-detached houses, townhouses and condominium apartments.

The MLS® Home Price Index Composite Benchmark was up by a similar annual rate of 3.6 per cent.

For the first half of 2019, the average selling price was $810,661, representing an increase of 2.4 per cent compared to the first half of 2018.

"Buyers started moving off the sidelines in the spring, as evidenced by strong year-over-year price growth throughout the second quarter. However, because we saw virtually no change in the number of new listings, market conditions tightened and price growth picked up, especially for more higher density home types, which, on average, are less-expensive than traditional detached houses and therefore provide more affordable housing options under the new OSFI stress test regime," said Jason Mercer, TREB's Chief Market Analyst.

If you’re thinking of making a move and would like to know how we can help, please contact us or more info.

April 2019 Market Stats: Infographic & Report

 
RLPS_Apr_Infographic_GTA_Let_May6_2019.jpg
 

April 2019 market stats are here!

The average sale price for the month was $820,148, up 1.9% compared to April 2018.

Here’s a breakdown of the average sale prices & year-over-year increases/decreases for the 416 area code:

  • Detached = $1,355,764 (+0.0%)

  • Semi-Detached = $1,051,765 (+2.9%)

  • Townhouse = $757,150 (-4.7%)

  • Condo Apartment = $637,181 (+5.8%)

And here’s TREB’s official market report for the month of April 2019:

Toronto Real Estate Board President Garry Bhaura announced that Greater Toronto Area REALTORS® reported a substantial year-over-year increase in home sales in April 2019.

The number of residential transactions jumped by 16.8 per cent to 9,042 compared to 7,744 in April 2018.

On a preliminary seasonally adjusted basis, sales were up 11.3 per cent compared to March 2019.

New listings were also up year-over-year by eight per cent.

However, the annual growth rate for new listings was much lower than that reported for sales.

This suggests that market conditions continued to tighten which points toward an acceleration in price growth.

“The strong year-over-year growth in sales is obviously a good news story and likely represents some catchup from a slow start to the year. TREB’s sales outlook for 2019 anticipates an increase relative to 2018. It should be noted, however, that growth in new listings is not keeping pace with sales. This points to the ongoing housing supply issue in the GTA. In this regard TREB welcomes the provincial government’s Housing Supply Action Plan announced last week to reduce red tape and improve the mix of housing types. TREB provided input on the Plan through submissions and participation on working groups,” said Mr. Bhaura.

The year-over-year rate of price growth generally edged up in April relative to the first three months of the year.

The MLS® HPI Composite benchmark was up by 3.2 per cent – the highest rate of growth in more than a year.

The average selling price was up by 1.9 per cent to $820,148, representing the strongest annual rate of growth so far in 2019.

On a preliminary seasonally adjusted basis, the average selling price was also up by 1.1 per cent compared to March 2019.

Price growth continued to be driven by the condominium apartment segment and higher-density low-rise segments.

The average price for detached houses dipped year-over-year, specifically in regions surrounding the City of Toronto.

The detached market segment, with the highest price point on average, has arguably been hardest hit by measures such as the OSFI stress test.

“While sales were up year-over-year in April, it is important to note that they remain well-below April levels for much of the past decade. Many potential home buyers arguably remain on the sidelines as they reassess their options in light of the OSFI-mandated two percentage point stress test on mortgages. Longer term borrowing costs have trended lower this year and the outlook for short-term rates, for which the Bank of Canada holds the lever, is flat to down this year. Unfortunately, against this backdrop, we have seen no movement toward flexibility in the OSFI stress test,” said Jason Mercer, TREB’s Chief Market Analyst.

If you’re thinking of making a move and would like to know how we can help, please contact us or more info.

March 2019 Market Stats: Infographic & Report

 
RLPS_Mar_Infographic_GTA_Let_Apr4_2019.jpg
 

March 2019 market stats are here!

The average sale price for the month was $788,335, up 0.5% compared to March 2018.

Here’s a breakdown of the average sale prices & year-over-year increases/decreases for the 416 area code:

  • Detached = $1,267,598 (-2.1%)

  • Semi-Detached = $1,020,561 (-1.3%)

  • Townhouse = $741,881 (+0.4%)

  • Condo Apartment = $603,969 (+2.3%)

And here’s TREB’s official market report for the month of March 2019:

Toronto Real Estate Board President Garry Bhaura announced that Greater Toronto Area REALTORS® reported 7,187 residential sales through TREB’s MLS® System in March 2019.

This result was inline with 7,188 sales reported in March 2018.

For the first quarter of 2019, sales were down by one per cent compared to Q1 2018.

While March and Q1 sales remained relatively flat compared to last year, new listings have declined more so than sales.

March new listings were down by 5.1 per cent year-over-year and Q1 new listings were down by 1.5 per cent.

“The OSFI stress test continues to impact home buyers’ ability to qualify for a mortgage. TREB is still arguing that the stress test provisions and mortgage lending guidelines generally, including allowable amortization periods for insured mortgages, should be reviewed. The supply of listings in the GTA also remains a problem. Bringing a greater diversity of ownership and rental housing online, including ‘missing middle’ home types, should be a priority of all levels of government. TREB is happy to be taking part in the City of Toronto’s consultations for the Housing TO – 2020-2030 Action Plan, and will certainly be raising the supply issue during these discussions,” said Mr. Bhaura.

“While the City of Toronto’s recently announced Housing TO – 2020-2030 Action Plan is exciting and commendable and TREB looks forward to contributing solutions as a Member of the External Advisory Committee, the recently proposed increase to the Municipal Land Transfer Tax on higher priced properties is problematic. As the recent City budget process showed, the MLTT is not a sustainable revenue source from which to fund municipal programs. On top of this, additional MLTT on higher priced homes could have a trickle-down effect on the supply of homes throughout the housing price continuum,” said TREB CEO John Di Michele.

The MLS® Home Price Index Composite Benchmark was up by 2.6 per cent year-over-year in March, while the average price for March sales was up by a lesser annual rate of 0.5 per cent to $788,335.

The average selling price for Q1 2019 was up by 1.1 per cent year-over-year.

“Market conditions have remained tight enough to support a moderate pace of price growth. Despite sales being markedly lower than the record levels of 2016 and early 2017, the supply of listings has also receded. This means that in many neighbourhoods throughout the GTA, we continue to see competition between buyers for available listings, which provides a level of support for home prices,” said Jason Mercer, TREB’s Chief Market Analyst..

If you’re thinking of making a move and would like to know how we can help, please contact us or more info.

February 2019 Market Stats: Infographic & Report

 
RLPS_Feb_Infographic_DT_Let_Mar5_2019.jpg
 

February 2019 market stats are here!

The average sale price for the month was $780,397, up 1.6% compared to February 2018.

Here’s a breakdown of the average sale prices & year-over-year increases/decreases for the 416 area code:

  • Detached = $1,294,936 (+0.8%)

  • Semi-Detached = $1,087,363 (+10.5%)

  • Townhouse = $764,569 (-1.7%)

  • Condo Apartment = $612,488 (+7.4%)

And here’s TREB’s official market report for the month of February 2019:

Toronto Real Estate Board President Gurcharan (Garry) Bhaura announced that Greater Toronto Area REALTORS® reported 5,025 homes sold through TREB's MLS® System in February 2019.

This sales total was down by 2.4 per cent on a year-over-year basis.

Sales were also down compared to January 2019 following preliminary seasonal adjustment.

"The OSFI mandated mortgage stress test has left some buyers on the sidelines who have struggled to qualify for the type of home they want to buy. The stress test should be reviewed and consideration should be given to bringing back 30 year amortizations for federally insured mortgages. There is a federal budget and election on the horizon. It will be interesting to see what policy measures are announced to help with home ownership affordability," said Mr. Bhaura.

Despite sales being down year-over-year, new listings actually declined by a greater annual rate.

This suggests that market conditions became tighter compared to last year.

Tighter market conditions continued to support year-over-year average price growth.

Both the MLS® Home Price Index Composite Benchmark and the average selling price were up modestly on a year-over-year basis in February 2019.

The MLS® HPI Composite Benchmark was up by 2.4 per cent year-over-year.

The average selling price for all home types combined was up by 1.6 per cent over the same period.

Price growth was driven by the condominium apartment segment and higher density low-rise home types.

On a preliminary seasonally adjusted basis the average selling price was down compared to January 2019.

"Home sales reported through TREB's MLS® System have a substantial impact on the Canadian economy. A study conducted by Altus for TREB found that, on average, each home sale reported through TREB resulted in $68,000 in spin-off expenditures accruing to the economy. With sales substantially lower than the 2016 record peak over the last two years, we have experienced a hit to the economy in the billions of dollars, in the GTA alone. This hit has also translated into lower government revenues and, if sustained, could impact the employment picture as well," said Jason Mercer, TREB's Director of Market Analysis and Service Channels.

If you’re thinking of making a move and would like to know how we can help, please contact us or more info.

January 2019 Market Stats: Infographic & Report

 
RLPS_Jan_Infographic_DT_Let_Feb7_2019.jpg
 

January 2019 market stats are here!

The average sale price for the month was $748,328, up 1.7% compared to January 2018.

Here’s a breakdown of the average sale prices & year-over-year increases/decreases for the 416 area code:

  • Detached = $1,174,134 (-8.8%)

  • Semi-Detached = $993,465 (+6.1%)

  • Townhouse = $797,528 (+12.3%)

  • Condo Apartment = $591,444 (+8.8%)

And here’s TREB’s official market report for the month of January 2019:

TREB President Garry Bhaura announced that Greater Toronto Area REALTORS® reported 4,009 home sales through TREB's MLS® in January 2019 – up by 0.6 per cent compared to January 2018.

On a preliminary seasonally adjusted basis, sales were up by 3.4 per cent compared to December 2018.

"It is encouraging to see the slight increase in January transactions on a year-over-year basis, even with the inclement weather experienced in the GTA region during the last week of the month. The fact that the number of transactions edged upwards is in line with TREB's forecast for higher sales in calendar year 2019," said Mr. Bhaura. 

The MLS® HPI Composite Benchmark price was up by 2.7 per cent compared to January 2018.

The condominium apartment market segment continued to lead the way in terms of price growth.

The average selling price was up by 1.7 per cent on a year-over-year basis.

After preliminary seasonal adjustment, the average selling price edged lower compared to December 2018.

"Market conditions in January, as represented by the relationship between sales and listings, continued to support moderate year-over-year price increases, regardless of the price measure considered. Given housing affordability concerns in the GTA, especially as it relates to mortgage qualification standards, we have seen tighter market conditions and stronger price growth associated with higher density low-rise home types and condominium apartments, which have lower average selling prices compared to single detached homes," said Jason Mercer, TREB's Director of Market Analysis and Service Channels.

If you’re thinking of making a move and would like to know how we can help, please contact us for more info.

December 2018 Market Stats: Infographic & Report

 
RLP Infographic.jpg
 

December 2018 market stats are here!

The average sale price for the month was $750,180, up 2.01% compared to December 2017.

Here’s a breakdown of the average sale prices & year-over-year increases/decreases for the 416 area code:

  • Detached = $1,145,892 (-8.0%)

  • Semi-Detached = $939,859 (+4.0%)

  • Townhouse = $714,456 (+10.0%)

  • Condo Apartment = $594,381 (+11.4%)

And here’s TREB’s official market report for the month of December 2018:

Toronto Real Estate Board President Garry Bhaura announced that Greater Toronto Area REALTORS® reported a total of 77,426 residential transactions through TREB’s MLS® System in 2018.

This result represented a 16.1 per cent decline compared to 92,263 sales reported in 2017.

Total new listings entered into TREB’s MLS® System were down by 12.7 per cent over the same period to 155,823.

The overall average selling price for 2018 transactions, at $787,300, was down by 4.3 per cent year-over-year for all home types combined across the TREB market area.

Home prices were up very slightly in the City of Toronto and down in the surrounding GTA regions.

This dichotomy reflects the fact that the condominium apartment segment, which accounted for a large proportion of sales in the City of Toronto, performed better from a pricing perspective than the detached market segment.

The average price for condominium apartment sales across the TREB market area was up by 7.8 per cent year-over-year.

“Higher borrowing costs coupled with the new mortgage stress test certainly prompted some households to temporarily move to the sidelines to reassess their housing options. With this said, it is important to note that market conditions were improved in the second half of the year, both from a sales and pricing standpoint,” said Garry Bhaura.

“After spiking in 2017, new listings receded markedly in 2018. In many neighbourhoods, despite fewer sales from a historic perspective, some buyers still struggled to find a home meeting their needs. The result was a resumption of a moderate year-over-year pace of home price growth in the second half of the year. Price growth was strongest for less- expensive home types, as many home buyers sought more affordable home ownership options,” said Jason Mercer, TREB’s Director of Market Analysis and Service Channels. .

If you’re thinking of making a move and would like to know how we can help, please contact us for more info.

November 2018 Market Stats: Infographic & Report

 
Market Infographic - November 2018.jpg
 

November 2018 market stats are here!

The average sale price for the month was $788,345, up 3.5% compared to November 2017.

Here’s a breakdown of the average sale prices & year-over-year increases/decreases for the 416 area code:

  • Detached = $1,301,382 (+1.8%)

  • Semi-Detached = $1,060,359 (+17.2%)

  • Townhouse = $739,837 (-2.9%)

  • Condo Apartment = $595,678 (+7.0%)

And here’s TREB’s official market report for the month of November 2018:

Toronto Real Estate Board President Garry Bhaura announced the continuation of moderate price growth in November 2018 compared to November 2017.

The MLS® Home Price Index (HPI) Composite Benchmark was up by 2.7 per cent year-over-year.

The average selling price was up by 3.5 per cent year-over-year to $788,345.

Greater Toronto Area REALTORS® reported 6,251 residential transactions through TREB's MLS® System in November 2018.

This result was down by 14.7 per cent compared to November 2017, when we saw a temporary upward shift in demand as the market was distorted by the looming OSFI-mandated stress test at the end of last year.

"New listings were actually down more than sales on a year-over-year basis in November. This suggests that, in many neighbourhoods, competition between buyers may have increased. Relatively tight market conditions over the past few months have provided the foundation for renewed price growth," said Mr. Bhaura.

On a preliminary seasonally adjusted basis, sales were down by 3.4 per cent compared to October 2018.

The average selling price after preliminary seasonal adjustment was down by 0.8 per cent compared to October 2018.

"Home types with lower average price points have been associated with stronger rates of price growth over the past few months. Given the impact of the OSFI-mandated mortgage stress test and higher borrowing costs on affordability, it makes sense that the condo apartment and semi-detached market segments experienced relatively stronger rates of price growth in November, as market conditions in these segments remained tight or tightened respectively over the past year," said Jason Mercer, TREB's Director of Market Analysis.

If you’re thinking of making a move and would like to know how we can help, please contact us for more info.